SVGMarks can be used to process images for electron-beam lithography or for general purposes.
Stitching in electron-beam lithography
This part of the manual demonstrates the use of SVGMarks when processing multiple images taken by an optical microscope or SEM. You can also watch the corresponding video tutorials. The files used in this manual can be downloaded from the Download section as a single zip file containing the used images.
After image transformation and stitching, the image can be automatically placed in a design file opened in Raith Nanosuite. The image can also be placed in other nanofabrication CAD software by manually inserting the coordinates provided by SVGMarks. If your nanofabrication software is not supported, please contact the author.
Click one of the buttons below to jump to the appropriate section of the manual related to image stitching.
Untransformed images Transformed imagesStitching of transformed images (see also the video tutorial)
SVGMarks can automatically transform multiple images based on the transformation of a given image. This is particularly useful when multiple images are taken with a microscope equipped with a motorized stage, which introduces the same distortion in all images. SVGMarks allows all the images to be transformed at once, using the previous transformation of one of the images. Here, the transformation of Multiple images is extended to stitching, as discussed below.
These images can also be stitched together into a large mosaic (composite) image, either before or after transformation. Image stitching is beneficial when the microscope cannot capture a large image at the same high resolution as the smaller images. However, stitching transformed images requires the presence of marks fabricated on the sample, unlike the stitching of untransformed images.
The images can be stitched together in two ways:
- Transforming each of the small images and then stitching the transformed images together into one large mosaic image. This is known as the Stitching after transformation approach. The advantage of this method is that all small images will be transformed, which is useful if some of them need to be opened in the design file. However, if only the mosaic image is needed, it is better to use the Transformation after stitching approach, as stitching transformed images does not produce a visually smooth mosaic image if the small images are heavily distorted (compare Figure 15 with Figure XX).
- Stitching the small images together first, then transforming the large image. This is known as the Transformation after stitching approach. This method creates the best-looking mosaic image but does not transform the small images. This means that only the mosaic image can be opened in the design file.
Both approaches are demonstrated below using the same example.
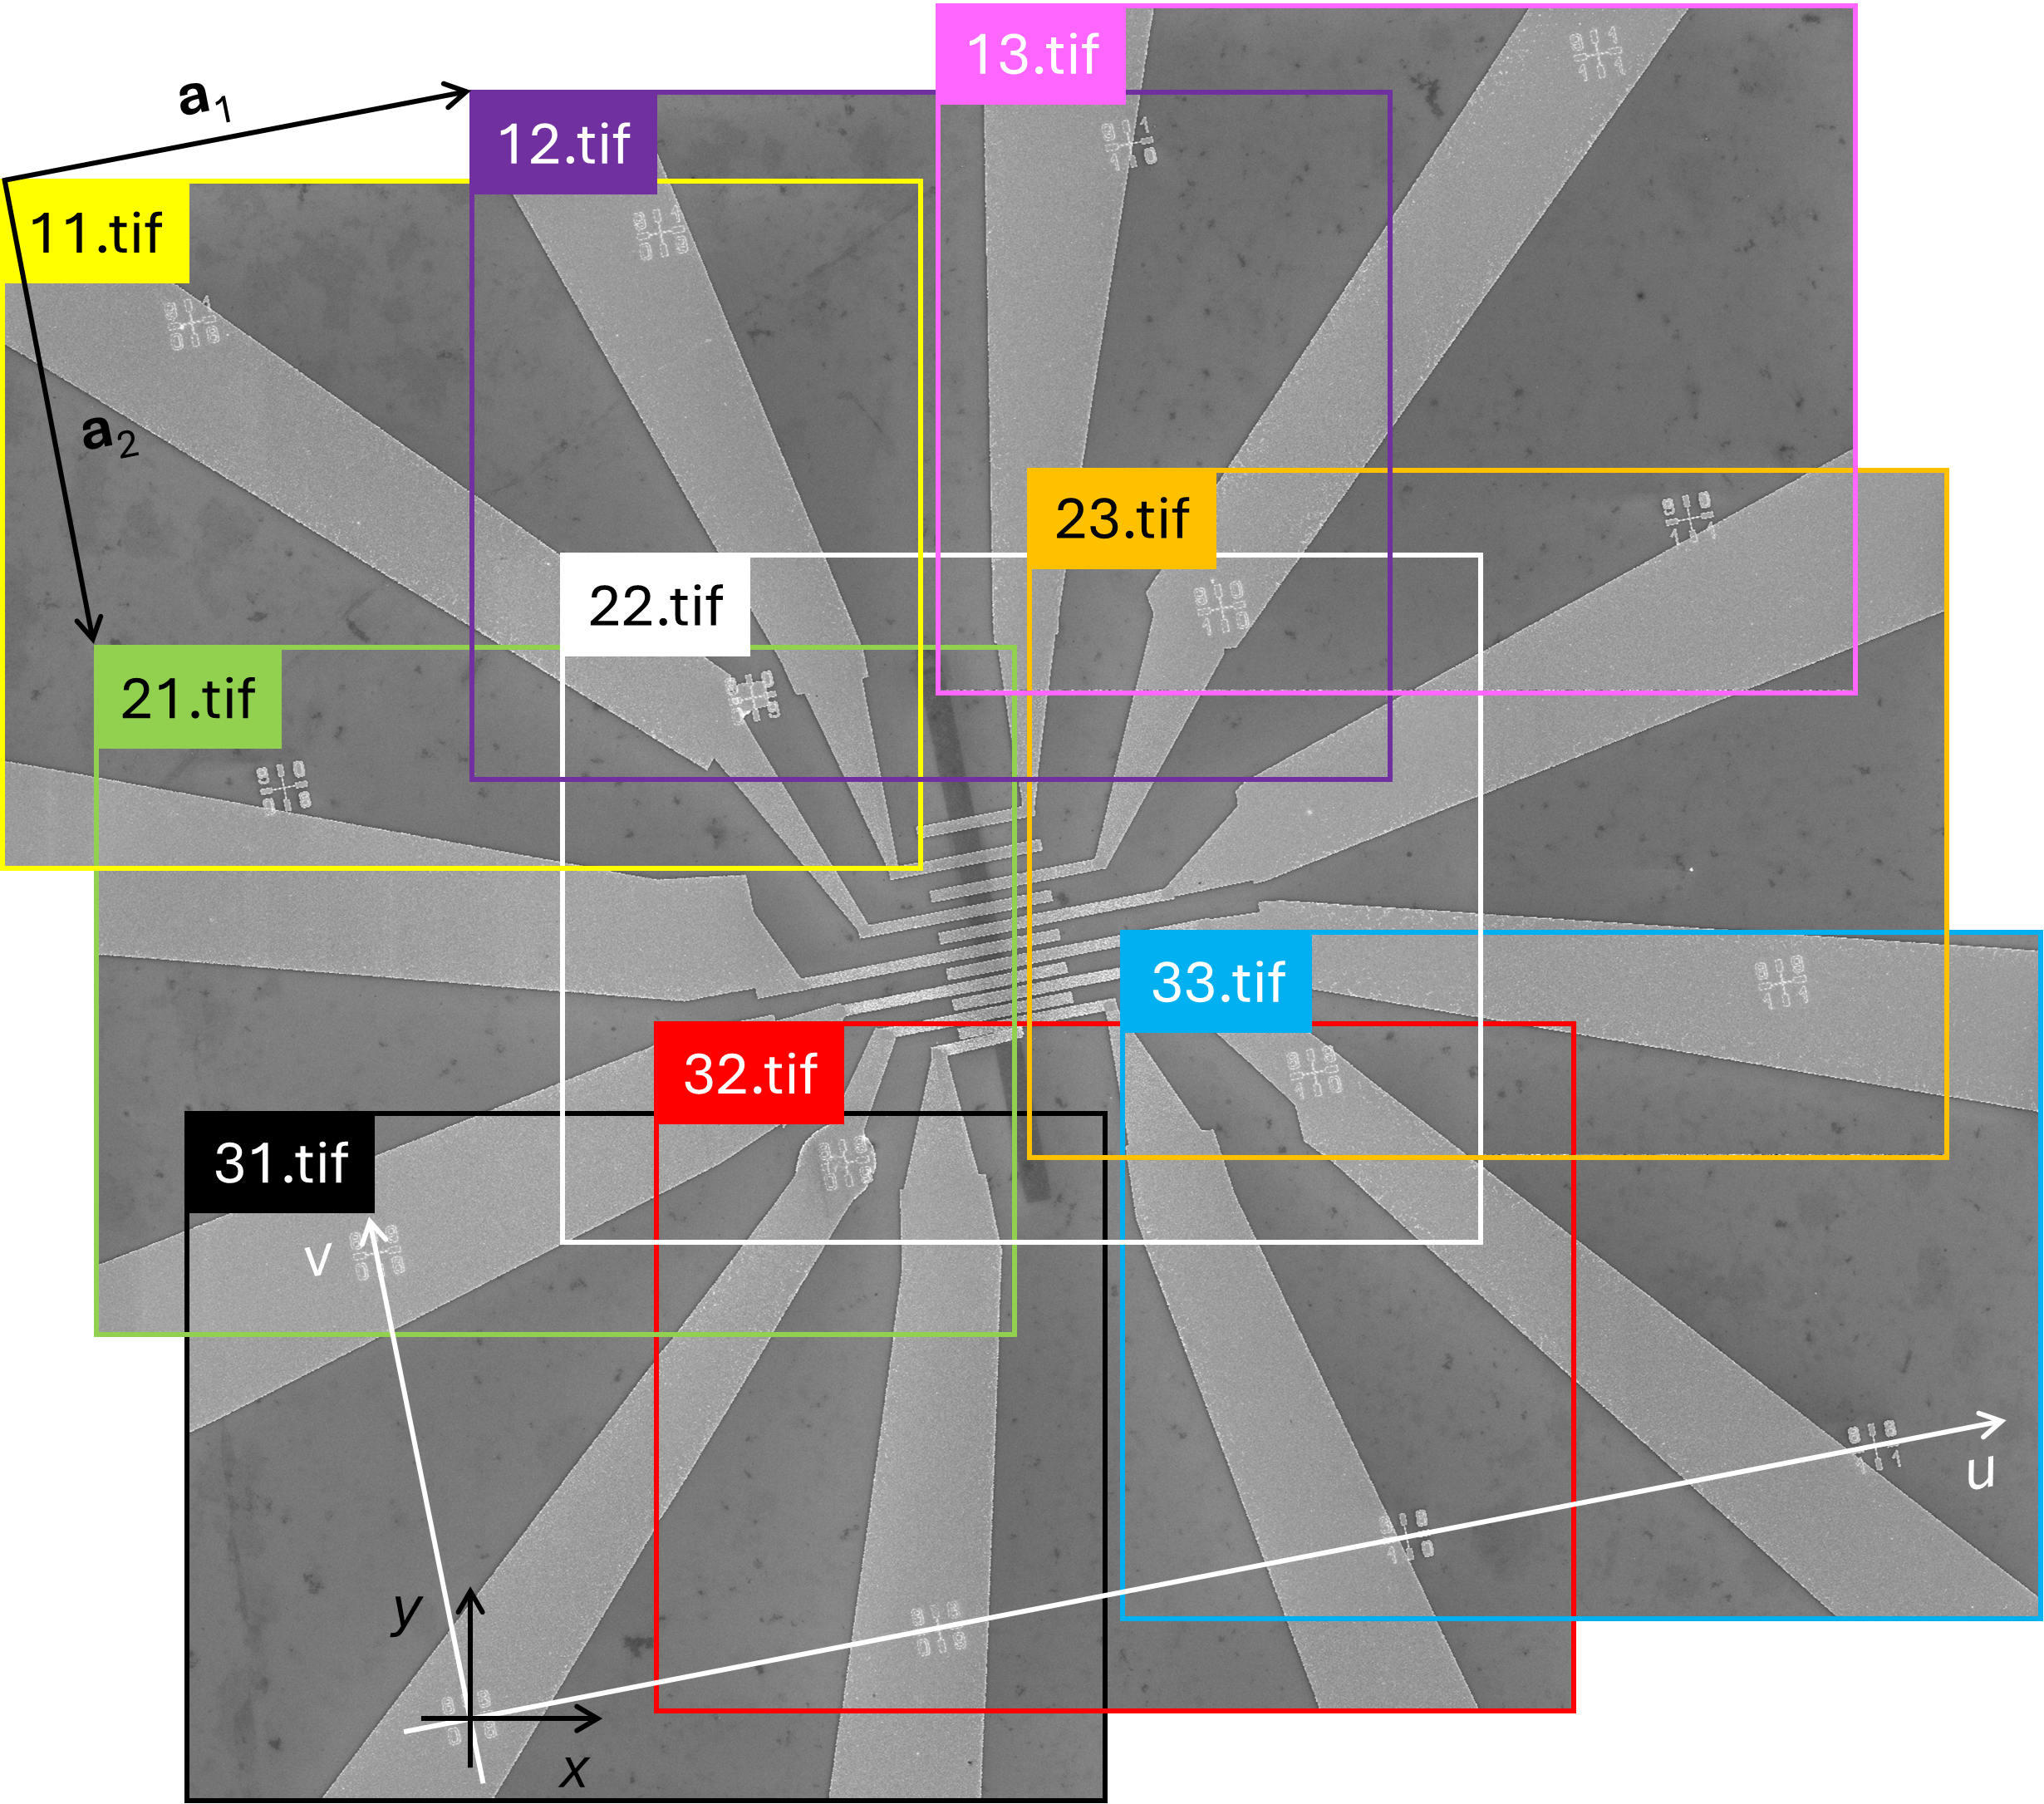
Figure 1 shows the contents of a folder containing 9 images captured using a scanning electron microscope (SEM), specifically the Raith eLINE system. The device shown in the images is intentionally rotated approximately 11 degrees counterclockwise to showcase the capabilities of SVGMarks.
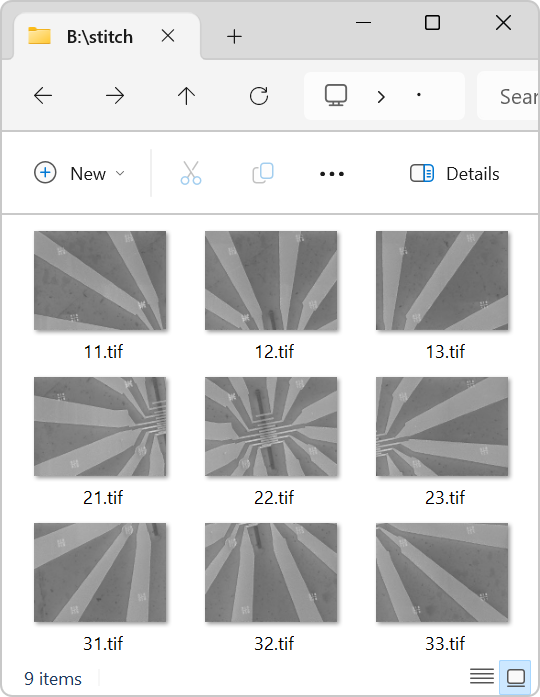
Figure 2 illustrates the raster scan pattern used by the microscope to capture the images. Starting at the top-left corner, the microscope captured images sequentially across the topmost row, labeled "11.jpg," "12.jpg," and "13.jpg." It then moved to the beginning of the next row to capture the second set of images, labeled "21.jpg," "22.jpg," and "23.jpg." After completing the first two rows, the microscope scanned the final row, the bottommost row, to capture the remaining images, labeled "31.jpg," "32.jpg," and "33.jpg." This process resulted in a total of 9 images captured across 3 rows.
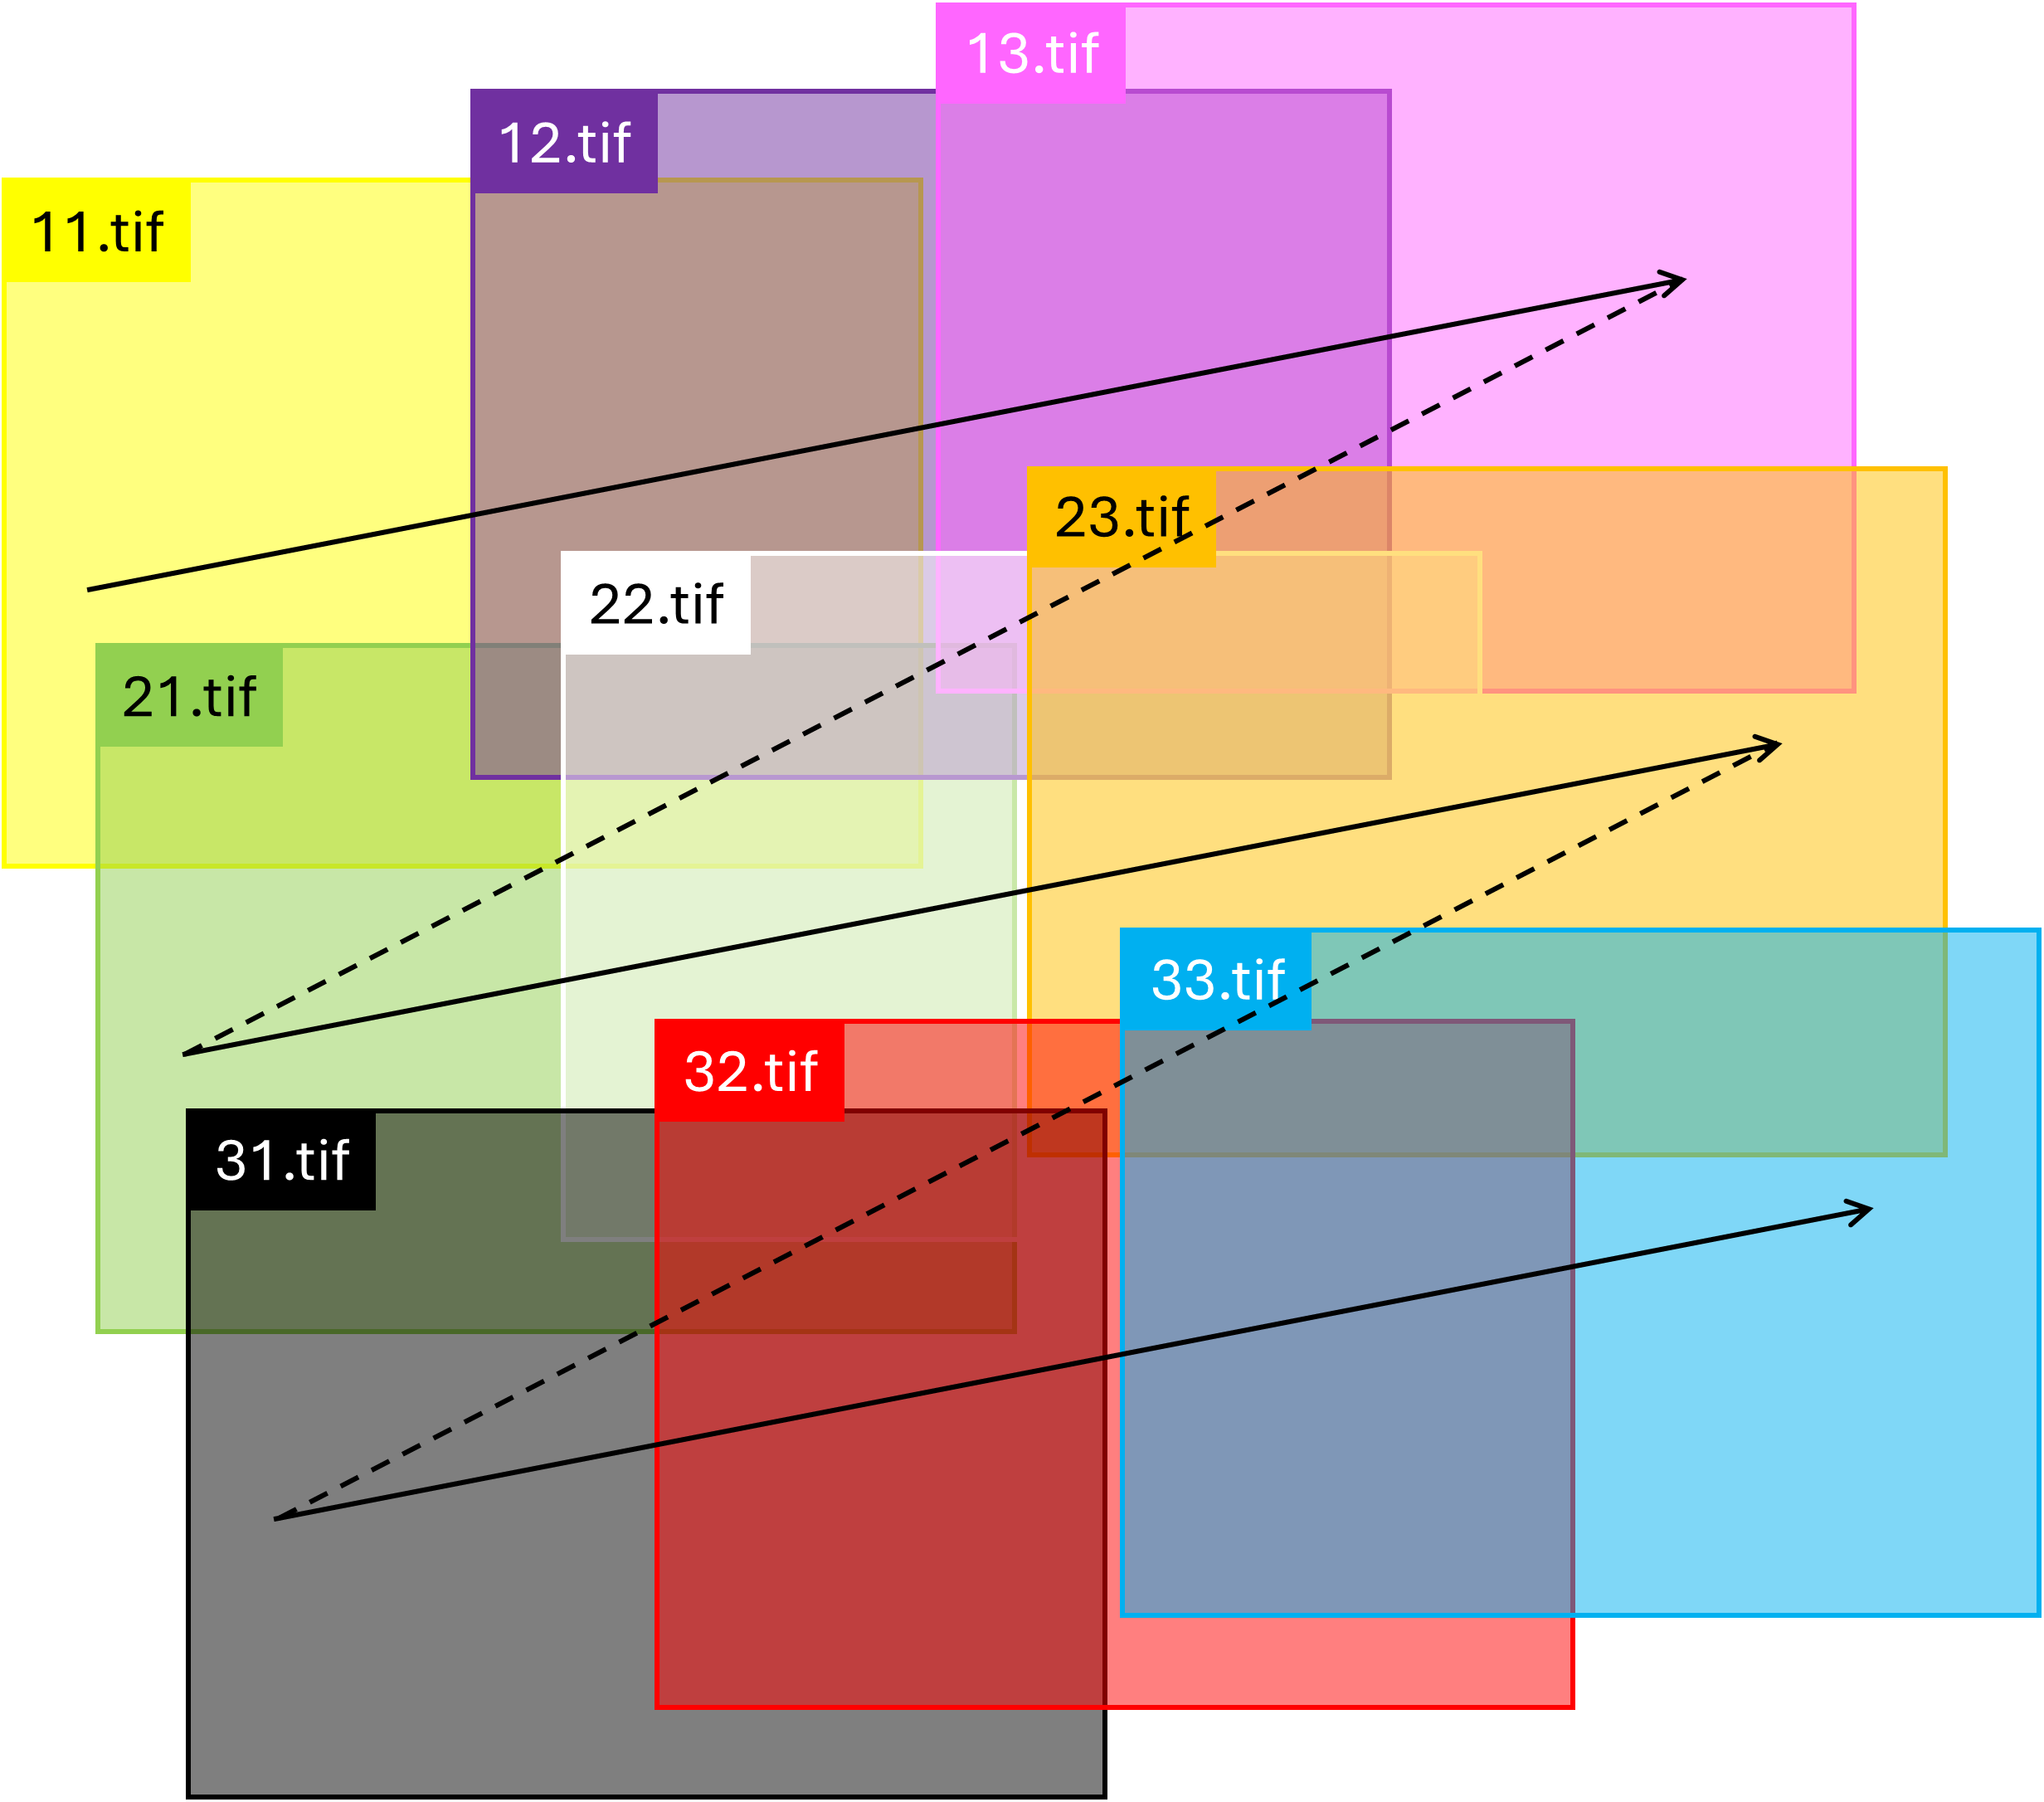
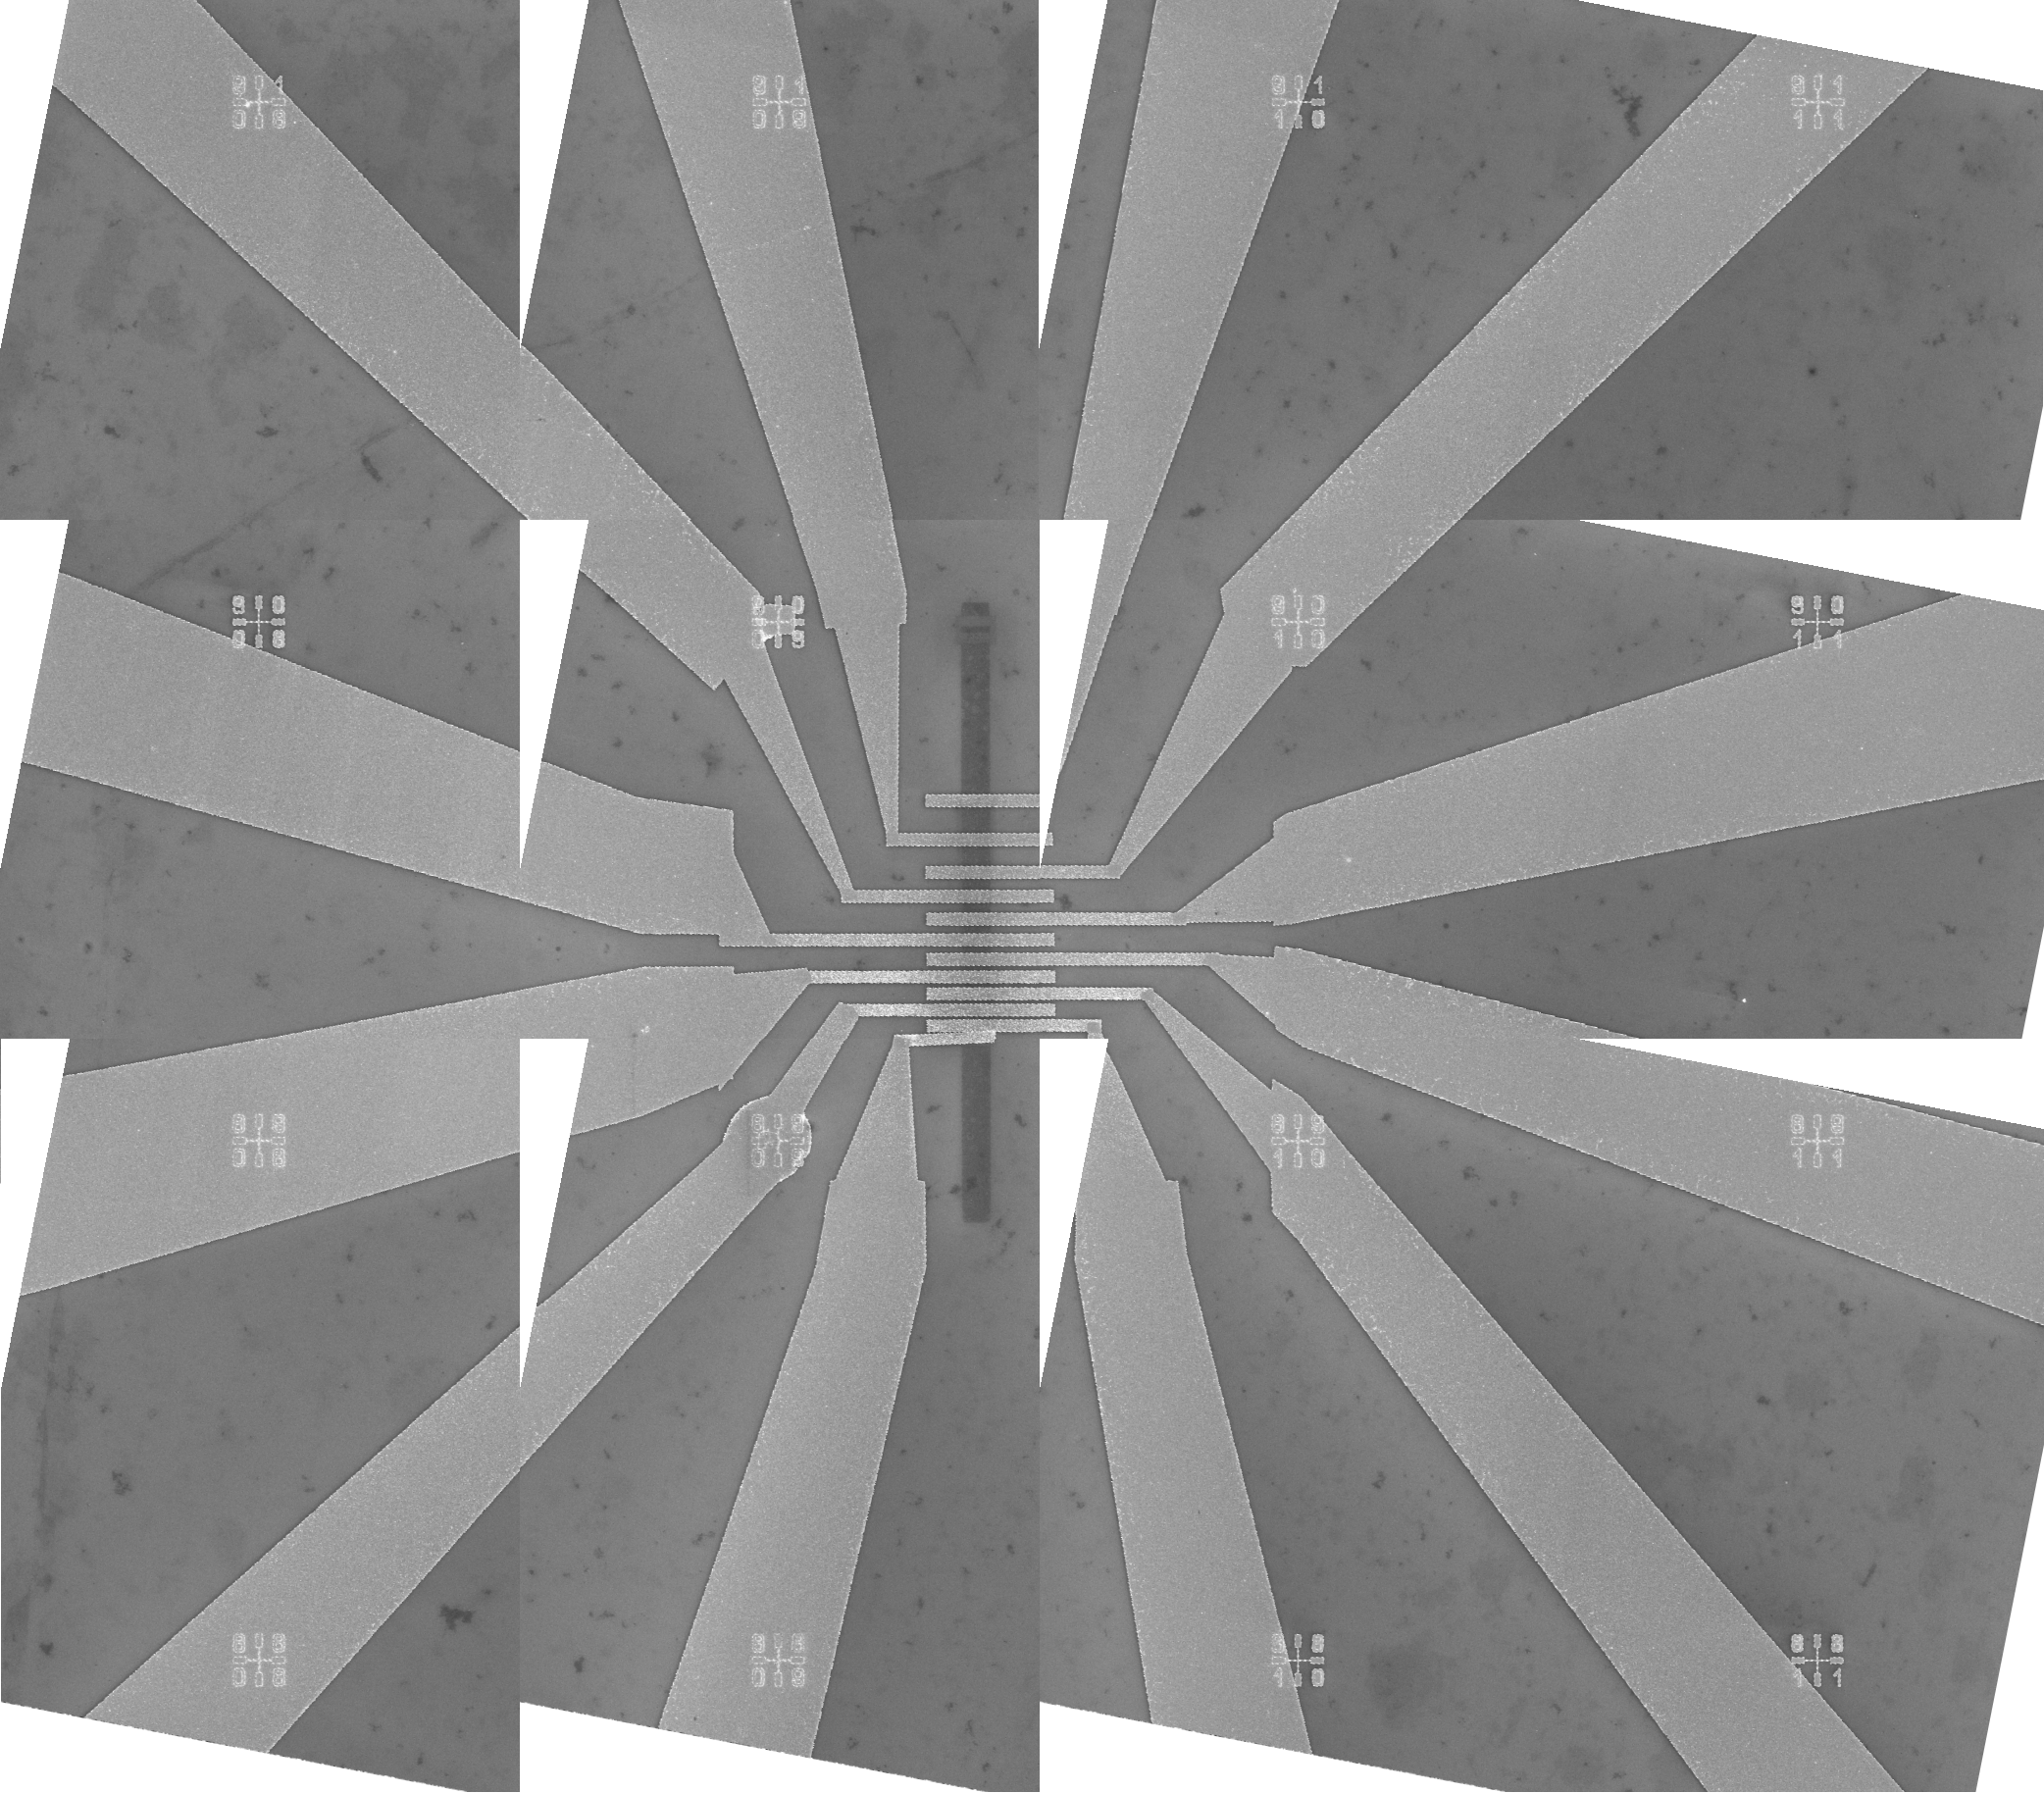
Figure 3 shows the images stitched together to reveal the device. As discussed above, the images were taken row by row: first the top row (images "11.tif", "12.tif", and "13.tif"), then the middle row (images "21.tif", "22.tif", and "23.tif"), and finally the bottom row (images "31.tif", "32.tif", and "33.tif"). When capturing the images in a row, the stage moved along the horizontal u axis (note that the u axis is not parallel to the actual horizontal x axis). Such a scanning direction was chosen to demonstrate that SVGMarks can stitch images in the most general case, i.e., even if they are not scanned along the horizontal axis. Similarly, the images are vertically offset along the direction of the v axis, which is not parallel to the actual vertical y axis.
Mathematically, the horizontal offset between neighboring images in a row is given by a translation vector a1, which is not parallel to the x axis. Likewise, the vertical offset between neighboring images in a column is given by a translation vector a2, which is not parallel to the y axis.
In this particular example, the u-v coordinate system is orthogonal (i.e., a1 ⋅ a2 = 0) because of the way the images were scanned (see more details in the caption of Figure 3). However, SVGMarks does not require the vectors a1 and a2 to be orthogonal for stitching the images, nor does it require knowledge of their components. Their components will be calculated by SVGMarks after placing the SVGMarks-generated marks on the marks fabricated on the sample.
Stitching after transformation
In the stitching-after-transformation approach, the (distorted) images are first transformed using SVGMarks to correct distortion, as described in Multiple Images. After transformation, the images are then stitched together. The complete procedure is detailed below.
-
Transform one of the images using SVGMarks, as explained in processing a Single image. While the choice of the image is arbitrary, it is recommended to transform the image captured first, typically located in one of the corners of the structure, to simplify the stitching procedure. In the example shown in Figure 1, the image 11.tif is selected. This image will be referred to as the reference image. Figure 4 illustrates the result of transforming 11.tif.
If the final stitched image (or some of the individual images) is to be imported into the design file, the correct coordinates of the marks should be used. In this case, the coordinates are Xmin = -960, Xmax = -880, Ymin = 5600, and Ymax = 5680, as these represent the positions of the marks in µm. However, if the images are not going to be inserted into the design file, the actual values of the coordinates become irrelevant. It is only important to preserve the aspect ratio of distances between the marks to avoid stretching the images. For example, you could use Xmin = Ymin = 0 and Xmax = Ymax = 1 if the images will not be inserted into the design file.
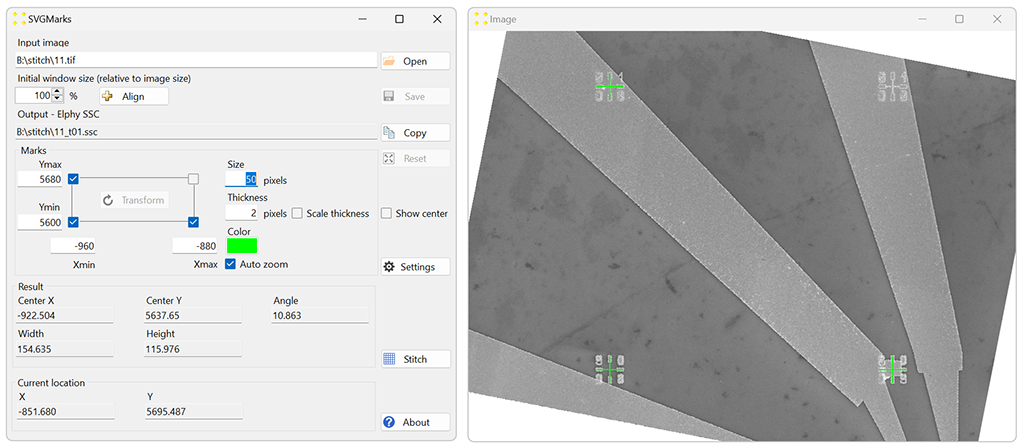
Figure 4. The result of the transformation of the image "11.tif". - Click the "Stitch" button to open the "Stitch" window shown in Figure 5.
By default, SVGMarks assumes that:
- The image transformed in the previous step ('11.tif') serves as the reference image, relative to which all other images should be transformed.
- All images to be transformed are stored in the same folder as the reference image.
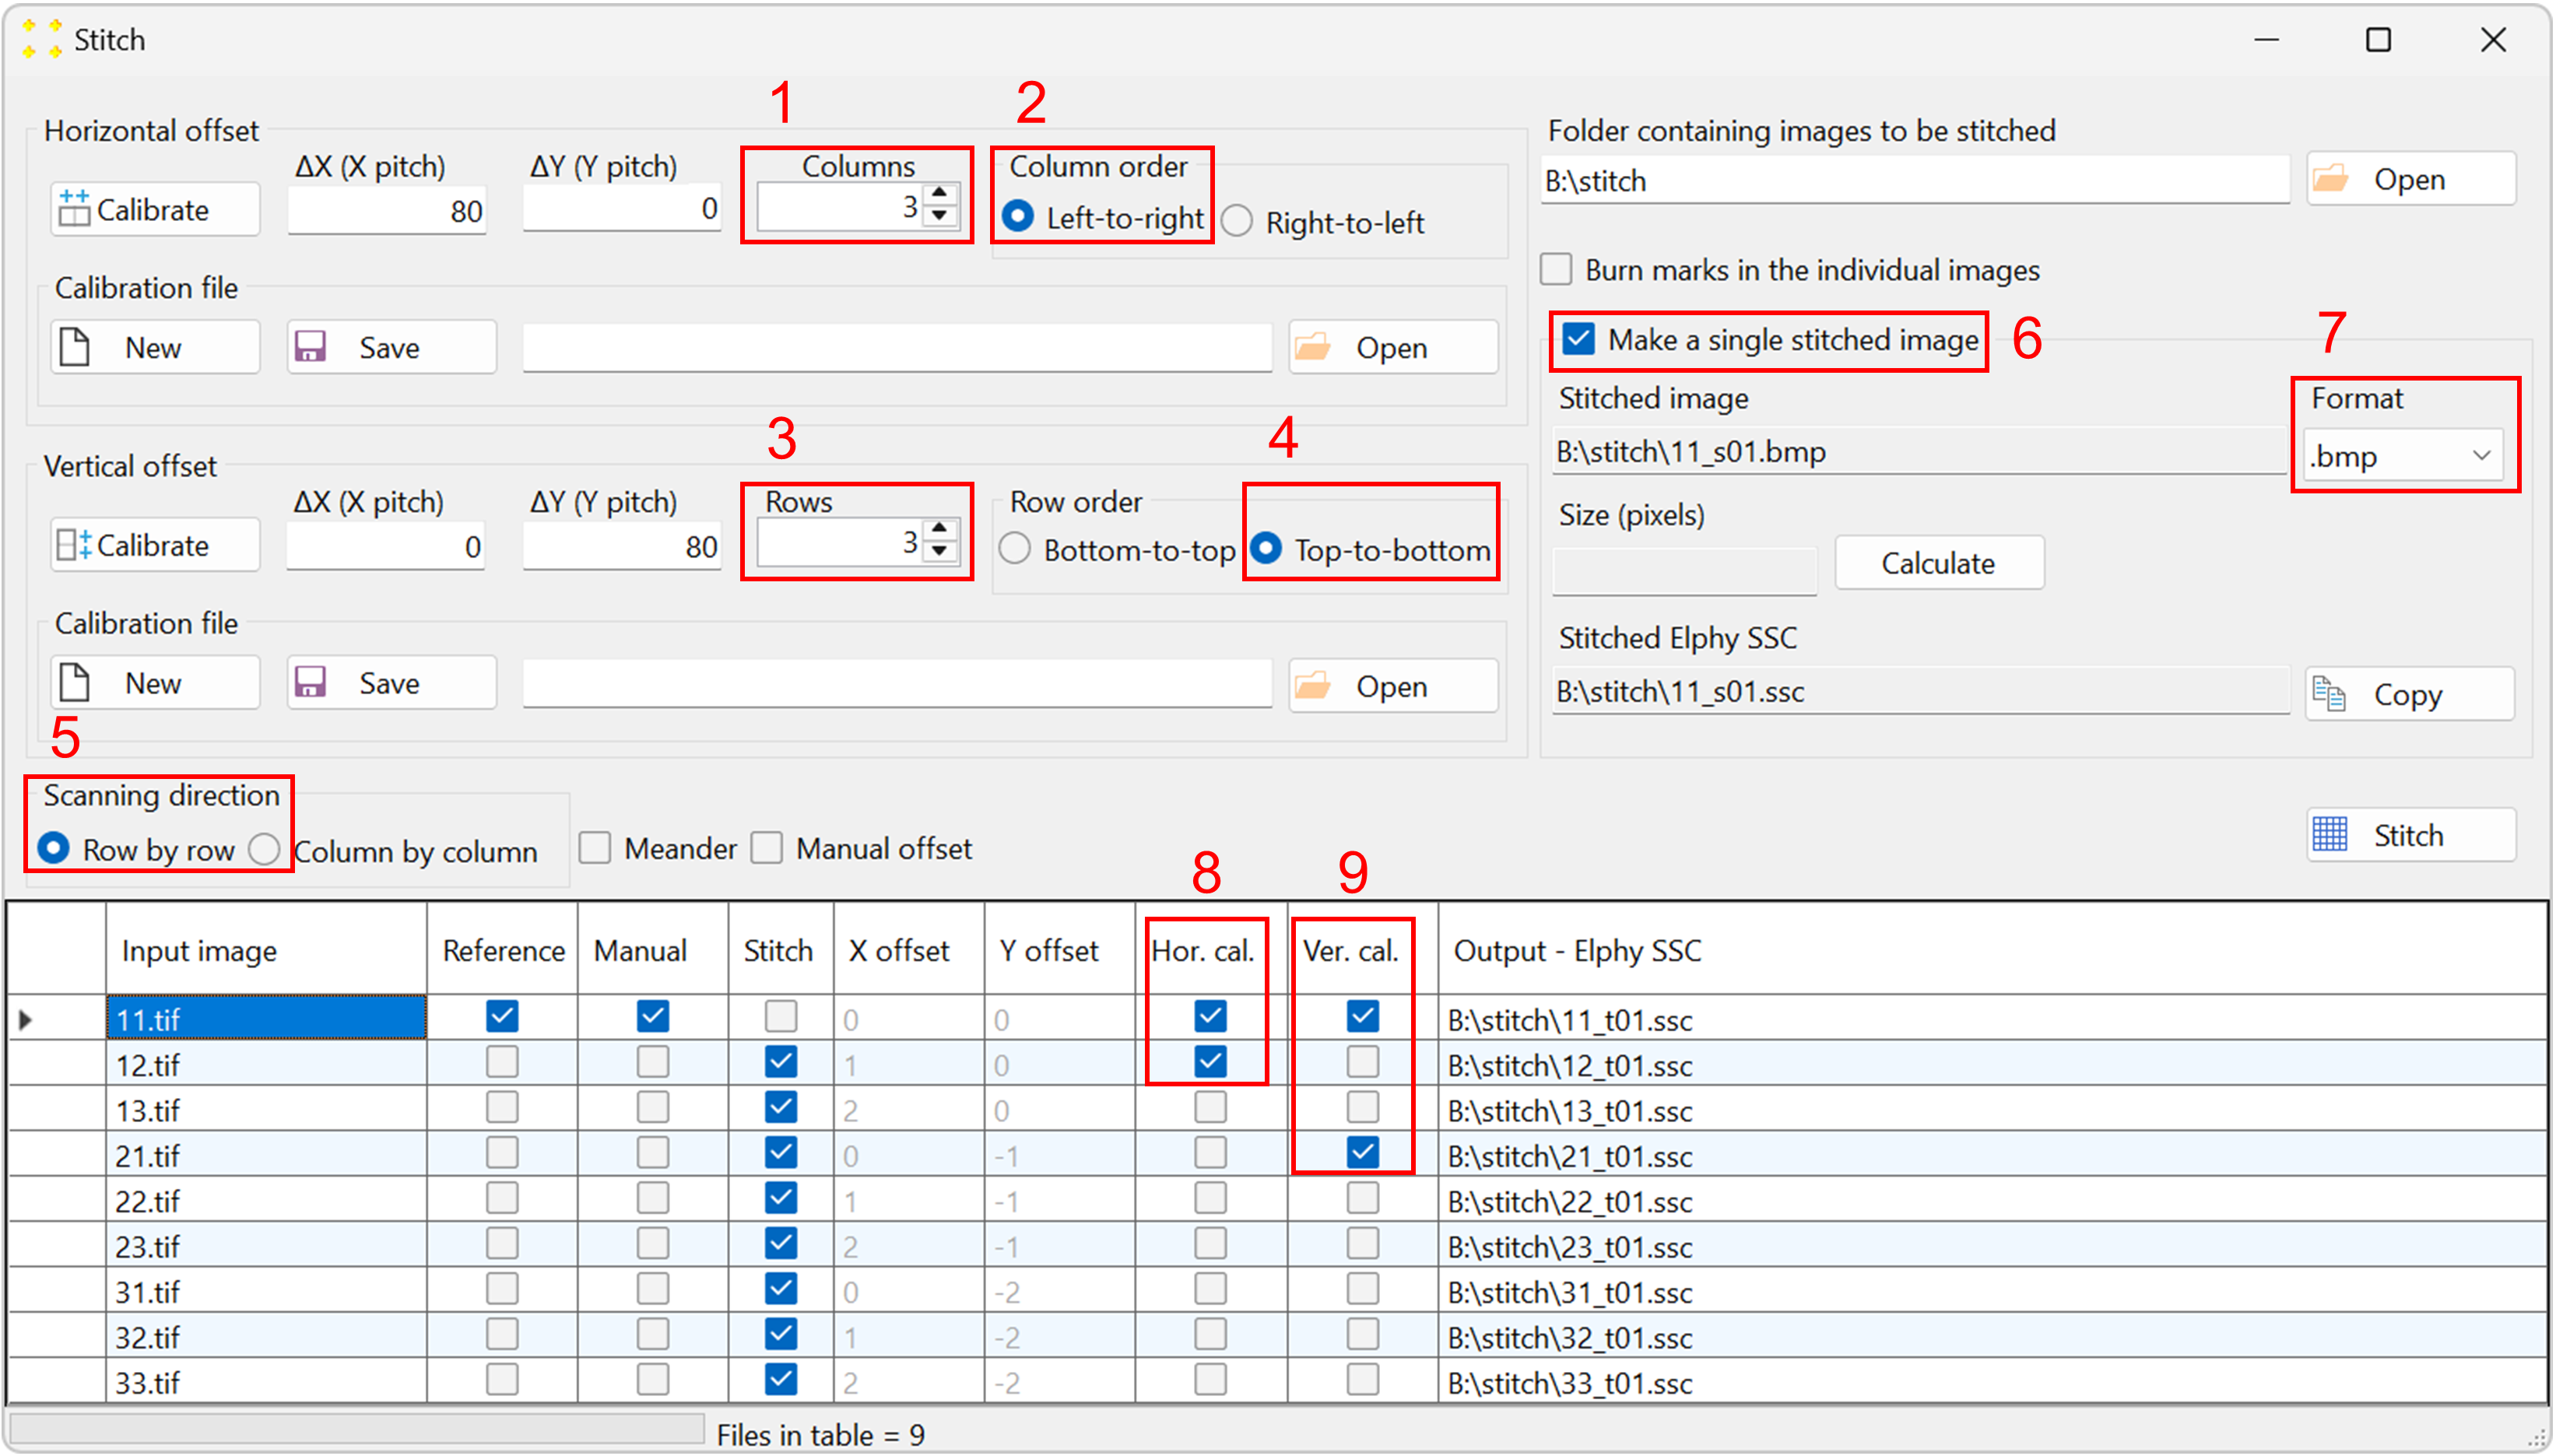
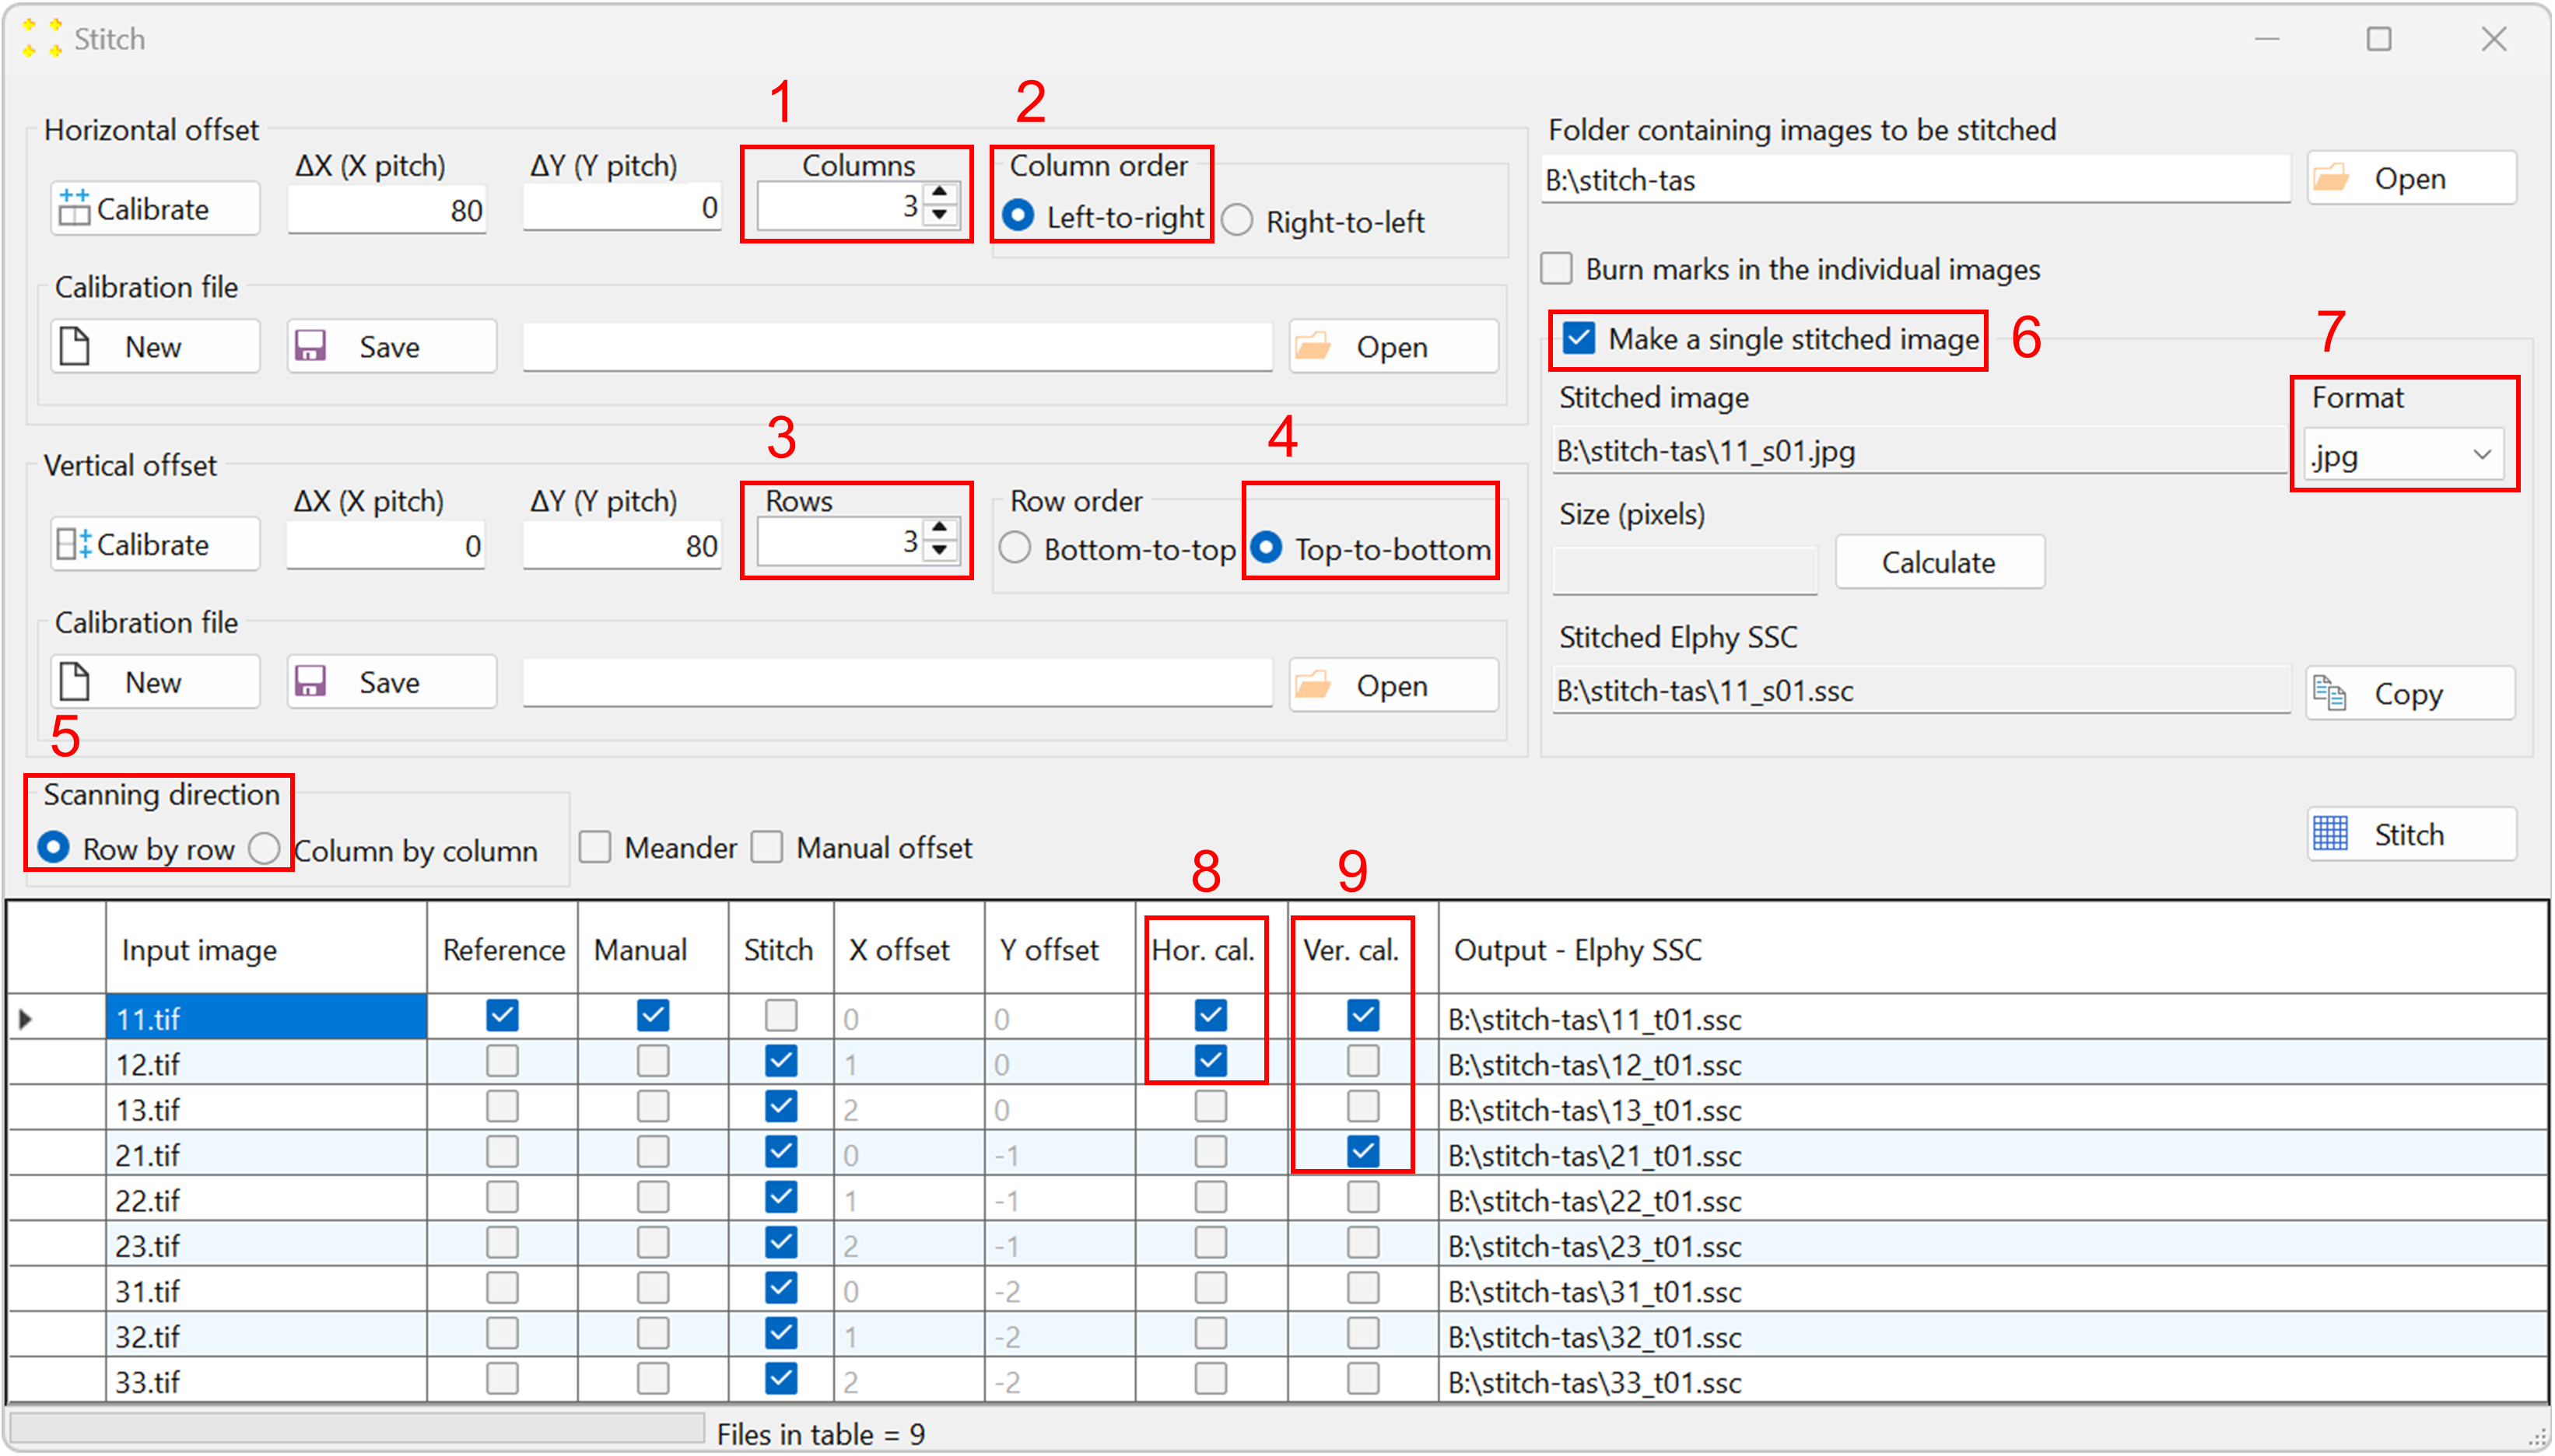
Figure 5. The 'Stitch' window, showing the stitching parameters selected for this example. - The "Input image" column contains the names of the reference image and the images to be transformed using the same transformation previously applied to the reference image.
- The "Reference" column contains check boxes indicating which image is the reference image. By default, SVGMarks always selects the previously transformed image (in this case "11.rtf") as the reference image. However, users have the option to choose the reference image by checking the corresponding check box in the "Reference" column. The reference image will not be transformed as SVGMarks assumes that the reference image has already been transformed.
- The "Manual" column is a read-only column that indicates the images that have already been transformed by SVGMarks. This is to inform users that the images, whose check boxes are checked, have already been transformed by SVGMarks and that they may not require the automatic transformation by the "Stitch" option.
- The "Stitch" column indicates which images should be transformed. By default, SVGMarks selects all images apart from the reference image to be transformed. Users have the option to exclude some of the images from the transformation by unchecking their check boxes.
- The columns 'X offset' and 'Y offset' contain horizontal and vertical image offsets, respectively, represented as integer multiples of the translation vectors a1 and a2. Let n and m denote the integers in the 'X offset' and 'Y offset' columns, respectively. An image in the table will be translated by the corresponding translation vector na1 + ma2 with respect to the reference image. These offsets are calculated relative to the reference image, which therefore has zero offsets. However, if the "Manual offset" checkbox above the table is selected, the values in these two columns can be edited manually. The vectors a1 and a2 will be determined as discussed below.
- The column "Output - Elphy SSC" contains the full file names of the SSC files that will be generated by transforming the images.
Set the stitch parameters as follows (the numbering corresponds to Figure 5, and the image ordering follows the raster pattern shown in Figure 2):
- The number of columns is set to 3.
- The columns are scanned from left to right.
- The number of rows is set to 3.
- The rows are scanned from top to bottom.
- The scanning direction is row-by-row.
- Check the "Make a single stitched image" checkbox to create the mosaic image.
- Keep the default extension ".bmp" in the "Format" combo box if the mosaic image will be inserted into Raith Nanosuite, as Raith Nanosuite does not support other image formats. If the mosaic image will not be inserted into the design file, select the ".jpg" format to reduce the file size.
The settings above configure the scanning direction but do not specify the distance (i.e., offset) between the images in the horizontal and vertical directions. To set the distance between the images, two neighboring images in both the horizontal and vertical directions should be selected. The choice of images is arbitrary; it is only important that the neighboring images (which overlap) are selected. For example:
- The images "11.tif" and "12.tif" are selected as two neighboring images in the horizontal direction (see Figure 2). The selection is made in the "Hor. cal." column of the table shown in Figure 5.
- The images "11.tif" and "21.tif" are selected as two neighboring images in the vertical direction (see Figure 2). The selection is made in the "Ver. cal." column of the table shown in Figure 5
-
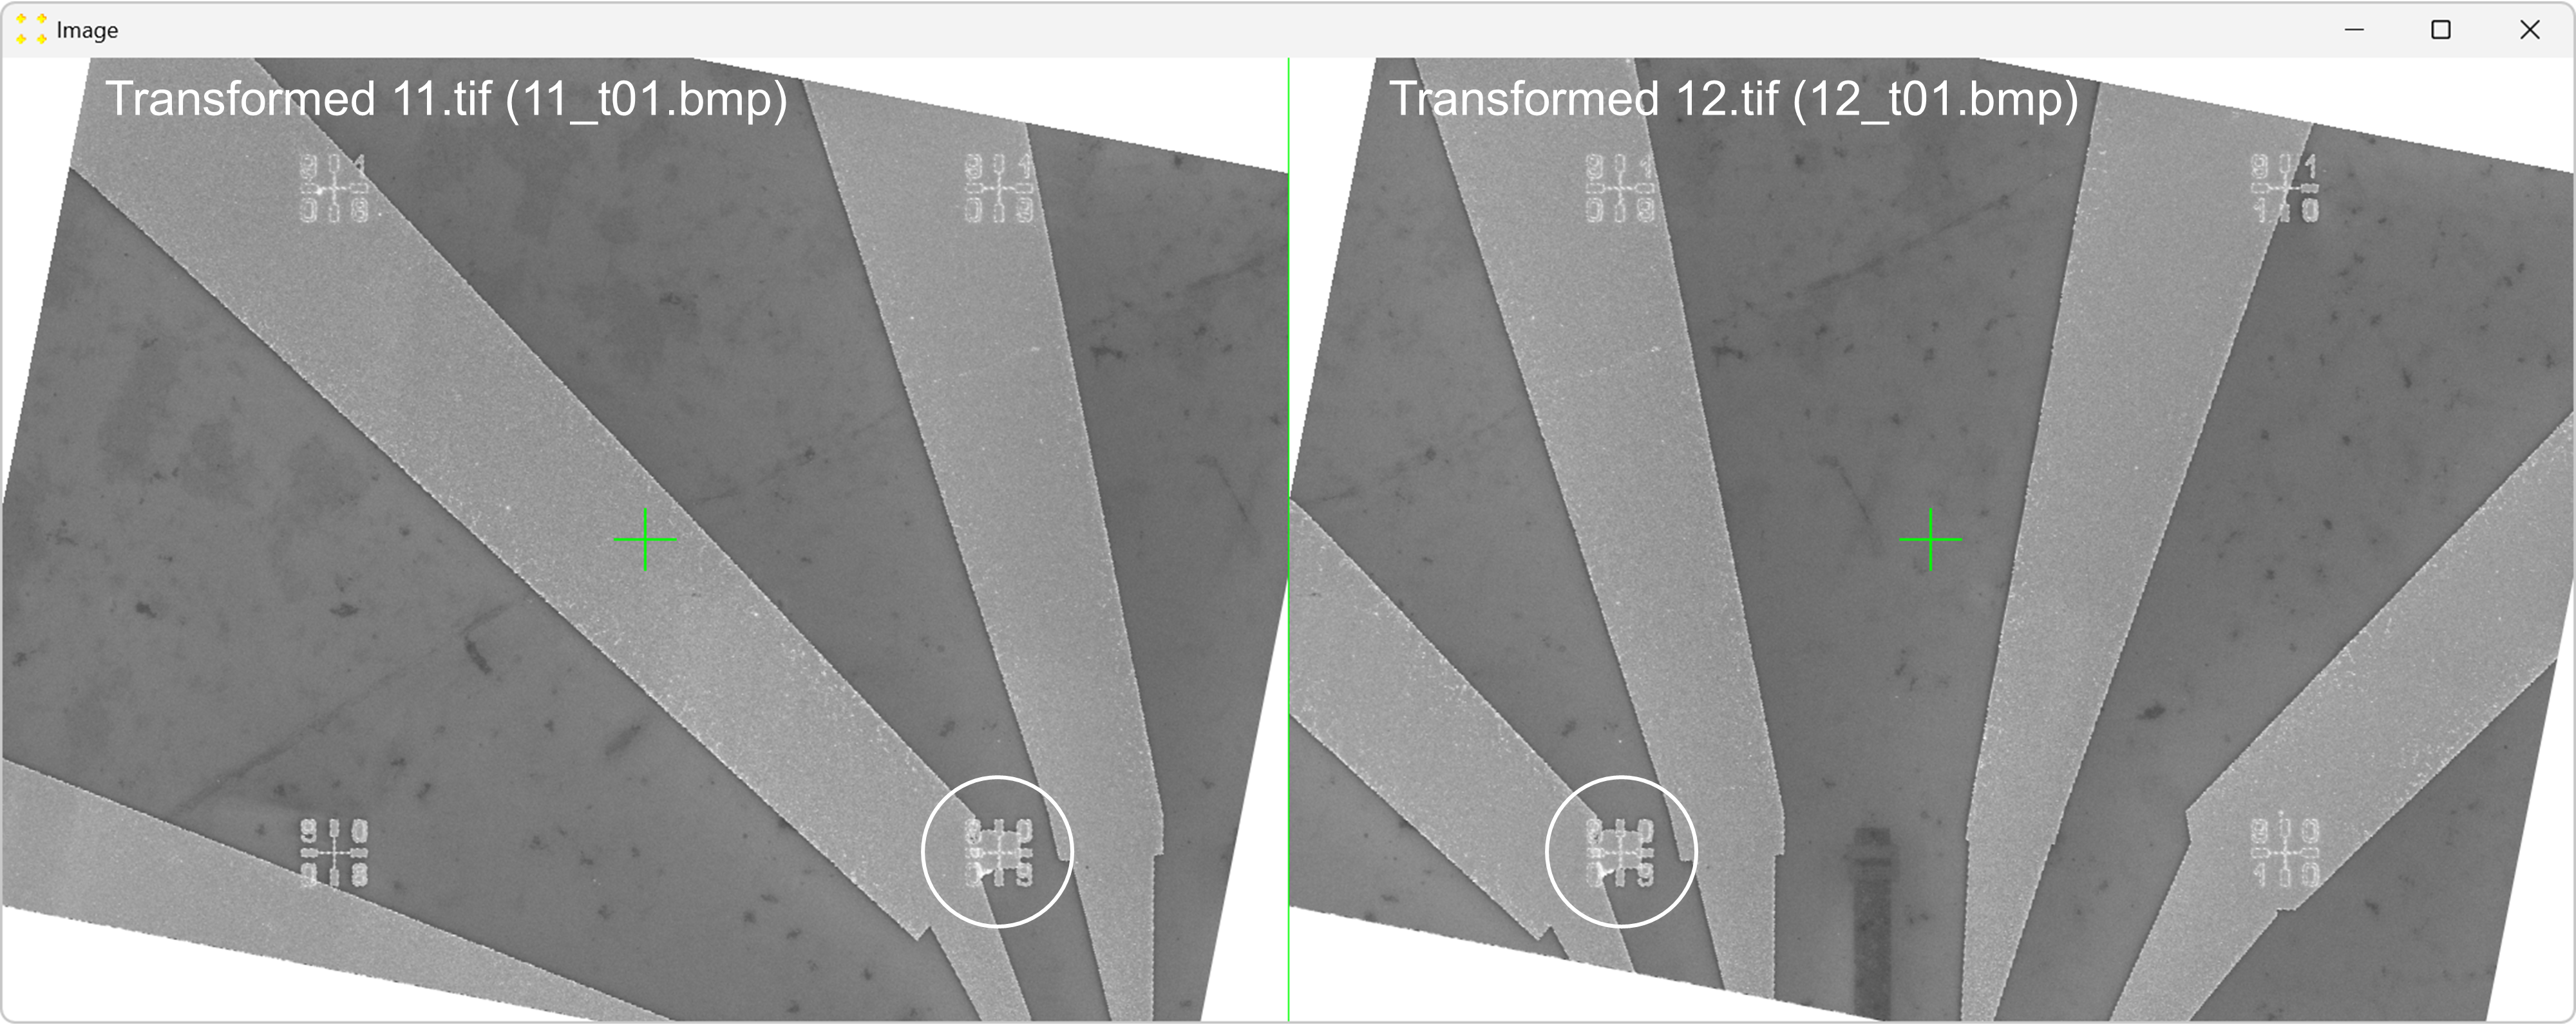
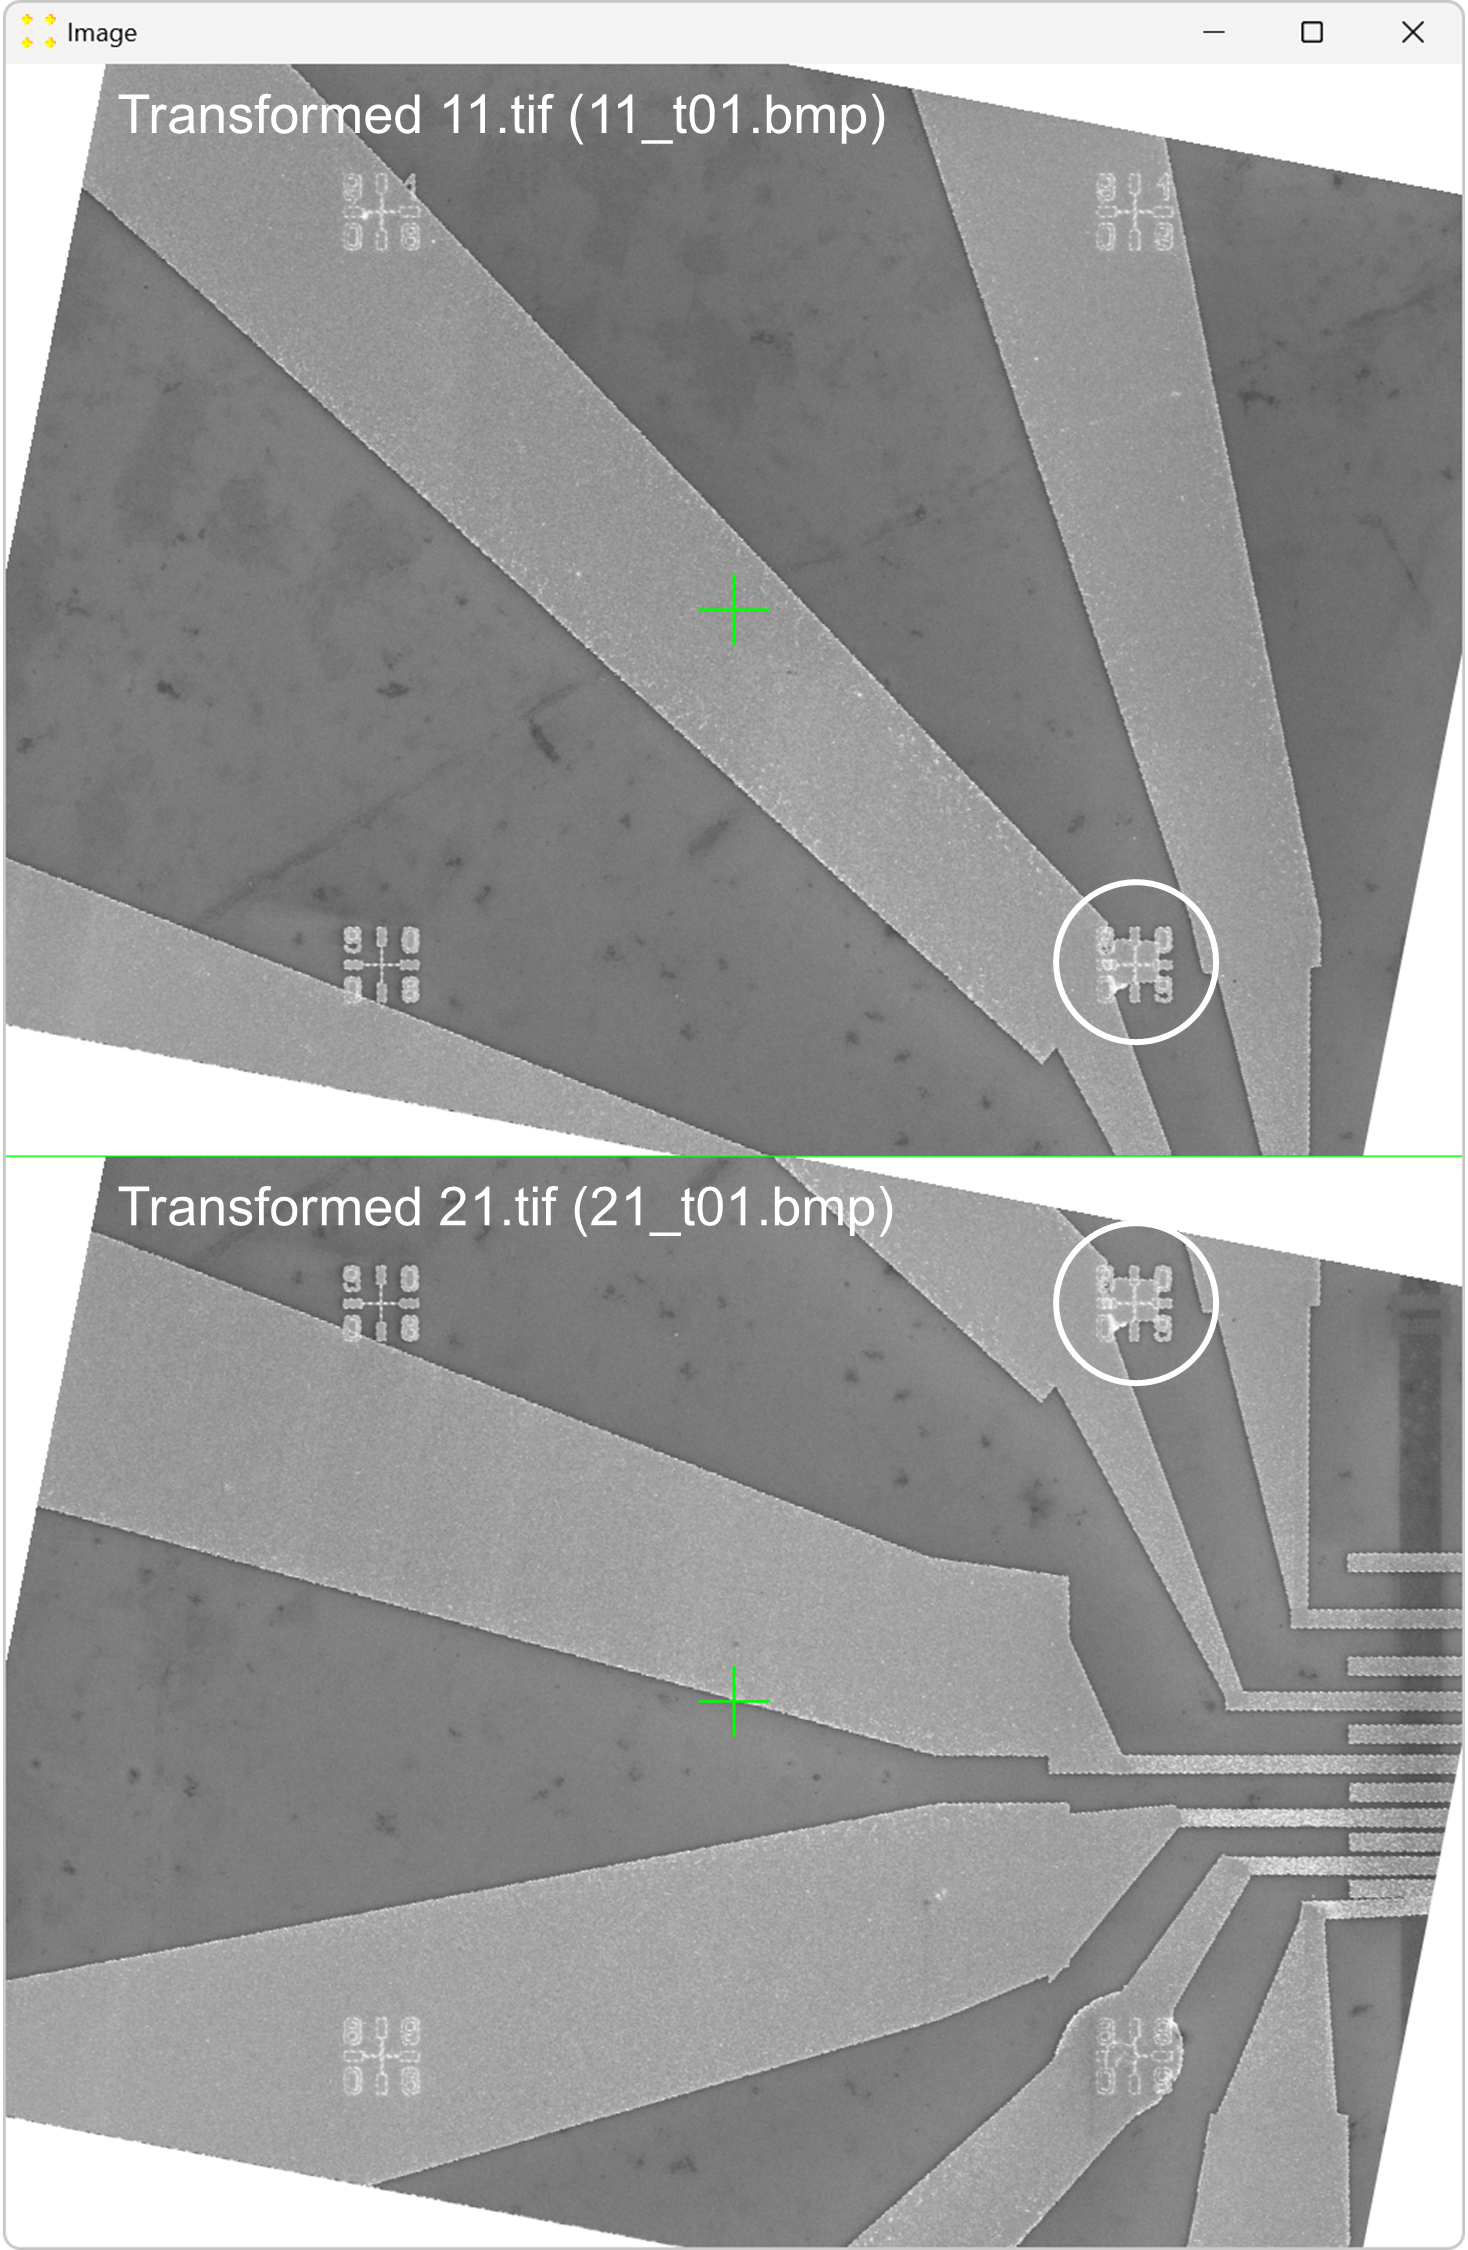
Click the "Calibrate" button in the "Horizontal offset" group box to open the images used to determine the horizontal offset between neighboring images. This will display the transformed versions of the images "11.tif" and "12.tif" side by side (i.e., "11_t01.bmp" and "12_t01.bmp") each with a single mark at its center, as shown in Figure 6. The images are separated by a line of the same color and thickness as the marks. The transformed image "12.tif" is displayed to the right of the transformed image "11.tif", which corresponds to the selected settings in the "Stitch" window (based on Figure 2).
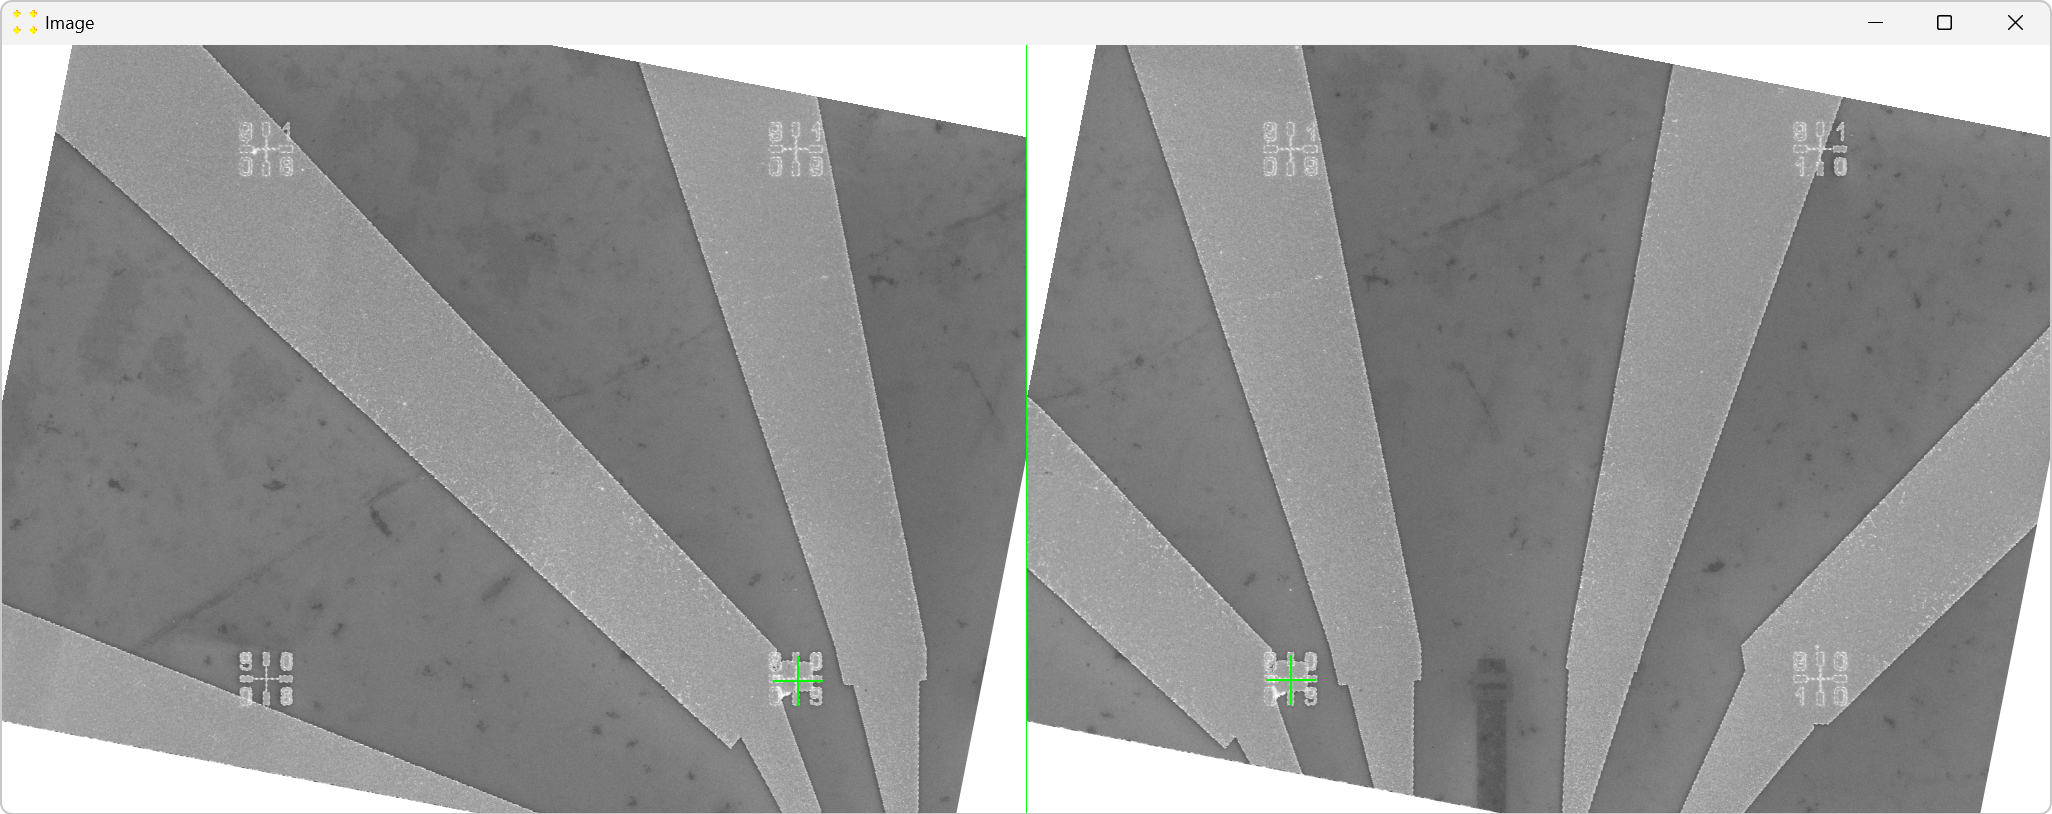
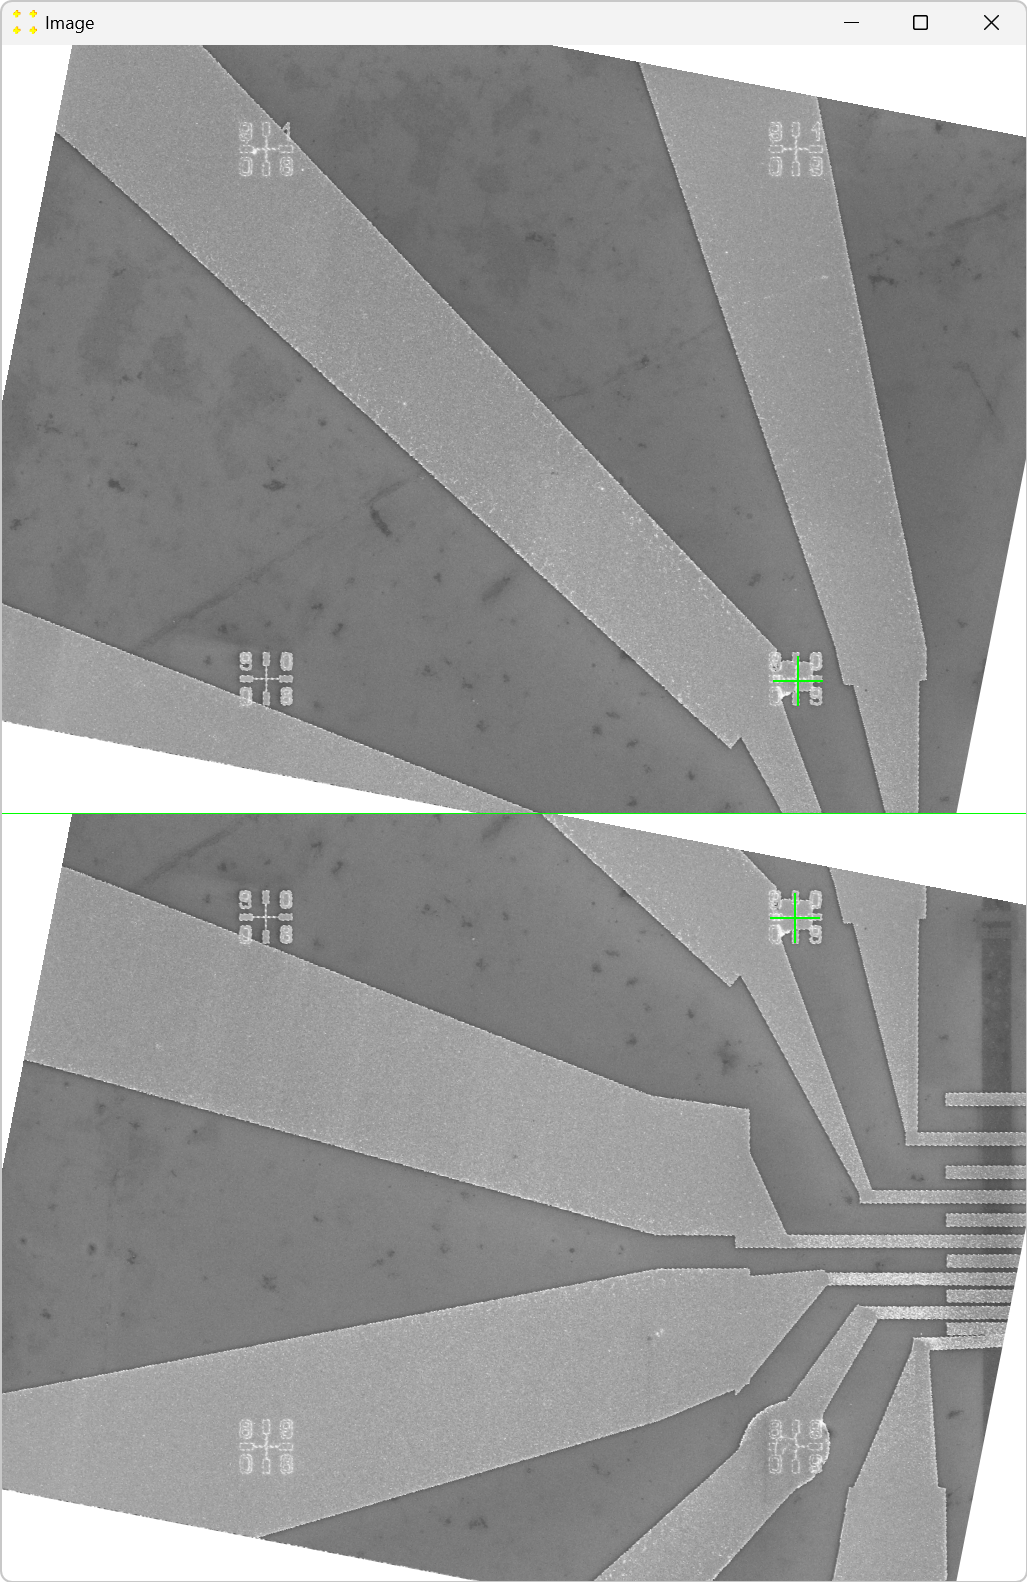
Roughly align the marks with the fabricated Au mark visible in their respective images, as shown in Figure 7.
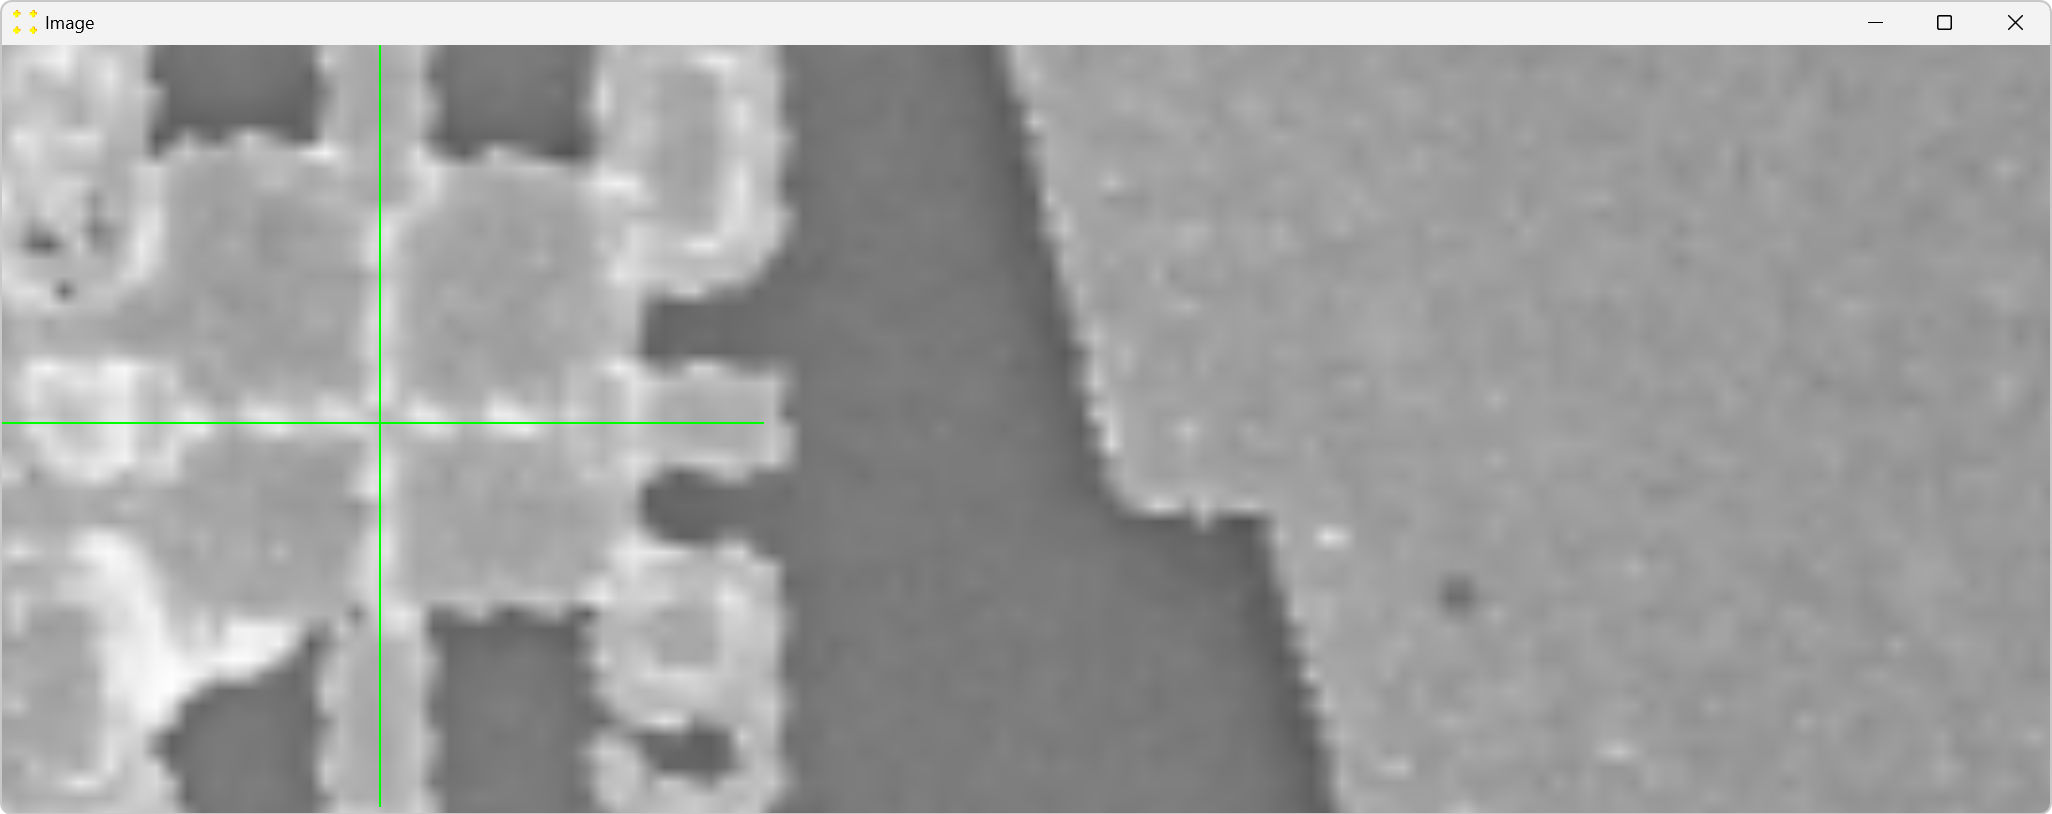
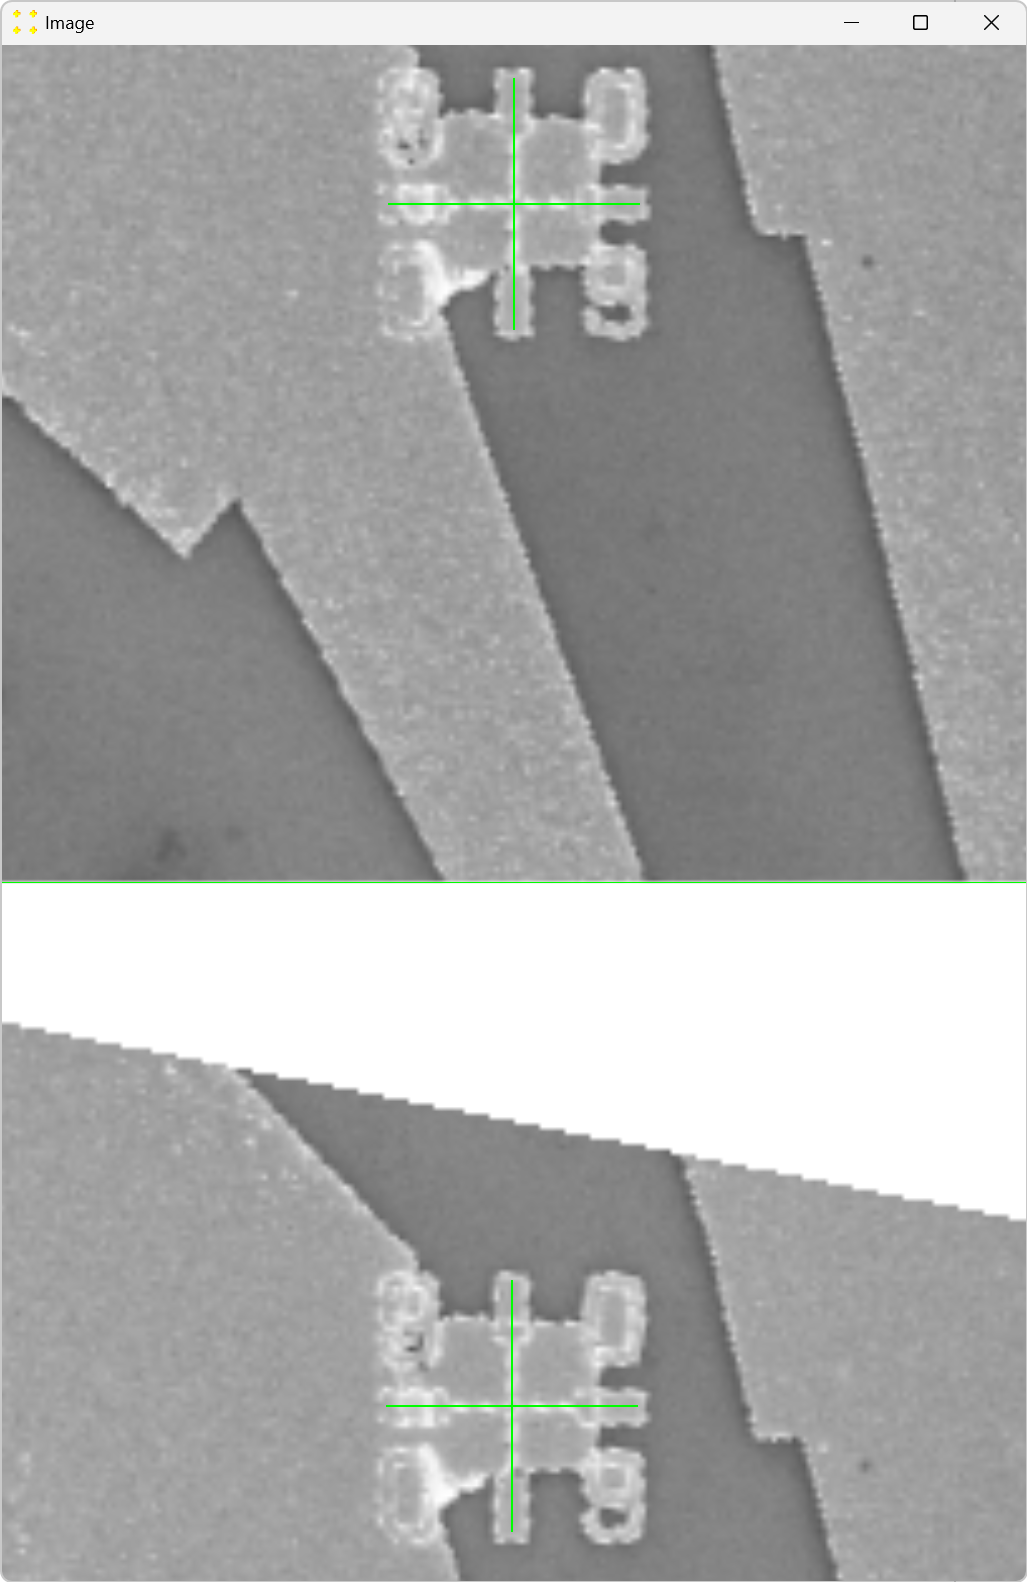
Double-click the marks to zoom in and precisely align them with the common Au mark, as shown in Figure 8. The zoom-in procedure is explained in detail in Single Image.
Close the window with the images and save your changes.
Click the "Calibrate" button in the "Vertical Offset" group box to open the images used to determine the vertical offset between neighboring images. This action will display the transformed images "11.tif" and "21.tif" (i.e., "11_t01.bmp" and "21_t01.bmp") stacked vertically, each with a single mark at its center, as shown in Figure 10. The images are separated by a line of the same color and thickness as the marks. The transformed image "21.tif" appears below "11.tif", reflecting the selected settings in the "Stitch" window (based on Figure 2).
Roughly align the marks with the common fabricated Au mark visible in their respective images, as shown in Figure 11.
Double-click the marks to zoom in and precisely align them with the common fabricated Au mark, as shown in Figure 12. The zoom-in procedure is explained in detail in Single image.
Close the window with the images and save your changes.
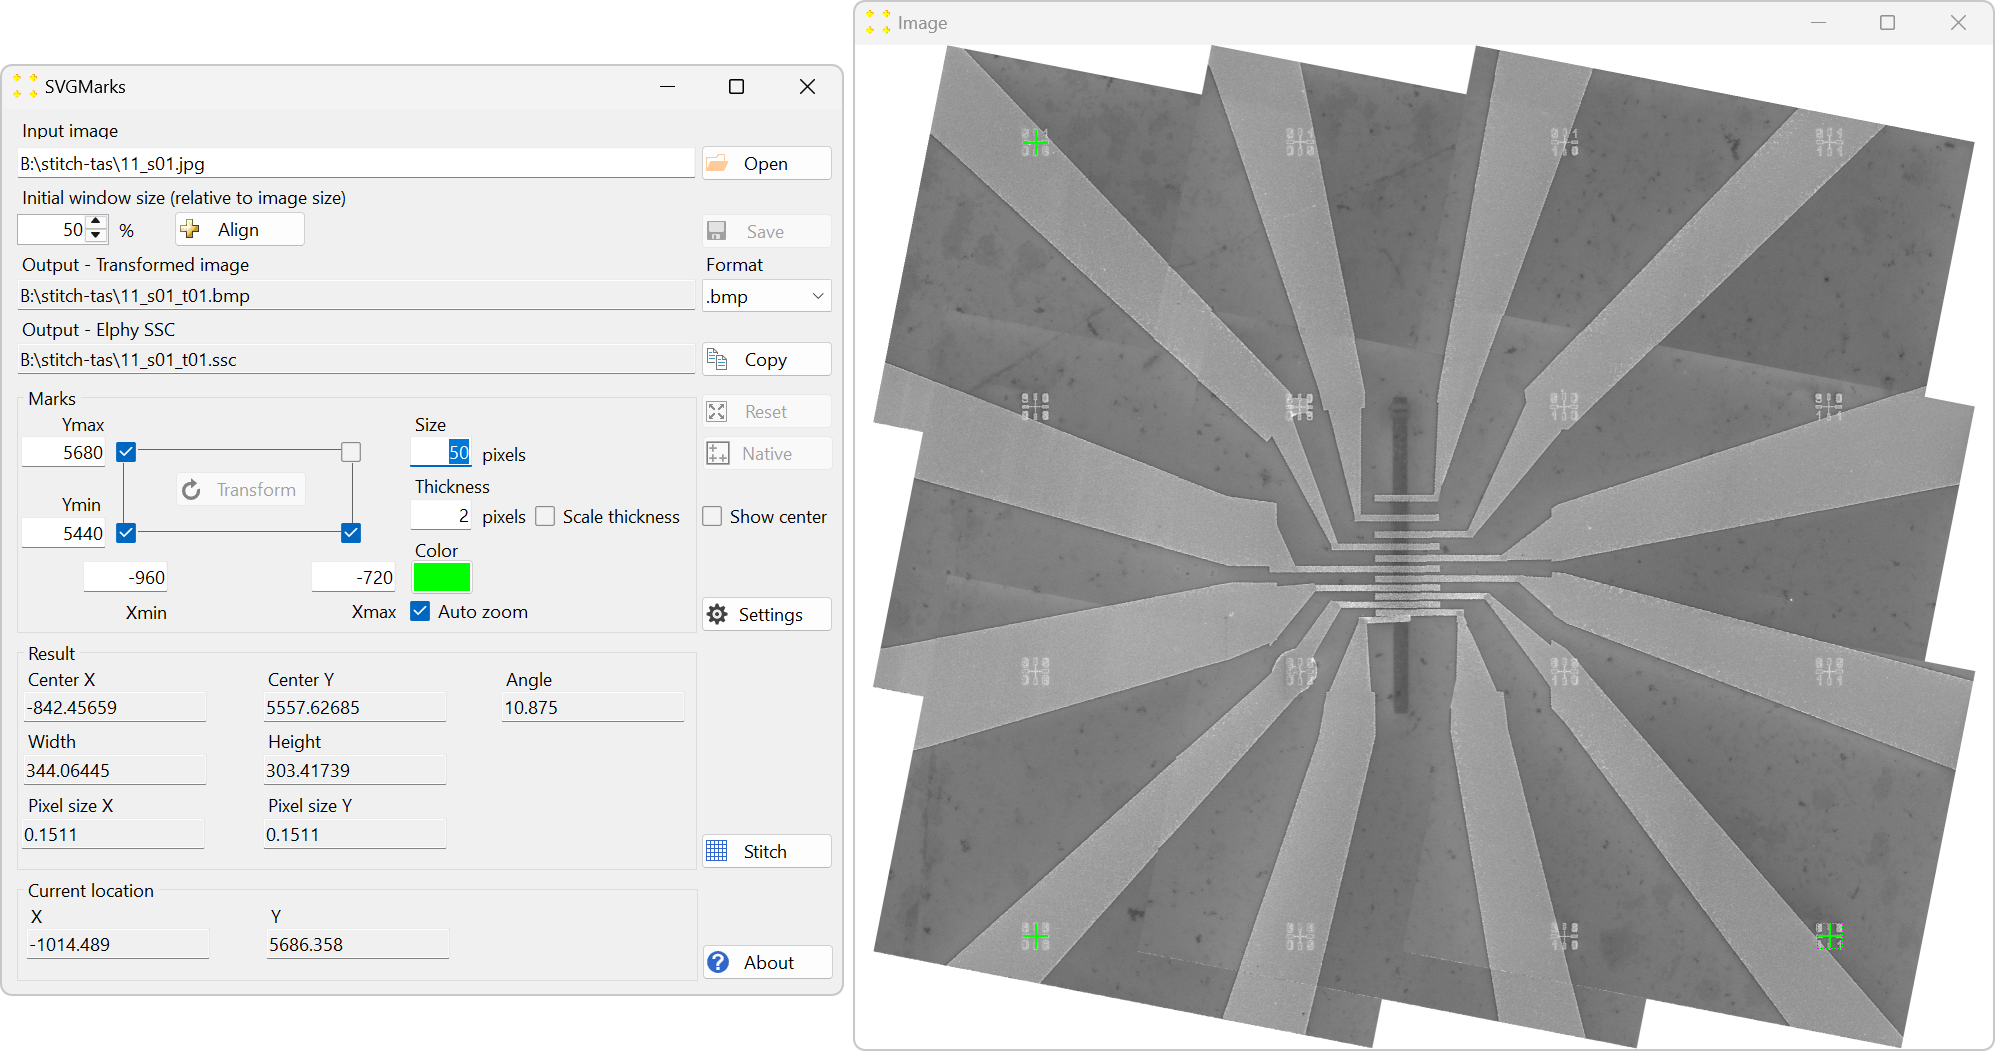
Click the "Stitch" button, shown in Figure 14, to perform stitching. This action will save the stitched mosaic image in the file "11_s01.bmp". The mosaic file is shown in Figure 15. The mosaic image displays a part of a chip with a graphene electronic device.
-
To load the transformed mosaic image in the corresponding design file, copy the SSC file name of the stitched file by clicking on the "Copy" button in the "Stitch" window (see Figure 14). Open the design file in Raith Nanosuite. To open the transformed image in Raith Nanosuite, click on "File" → "Open image..." and paste the copied file name.
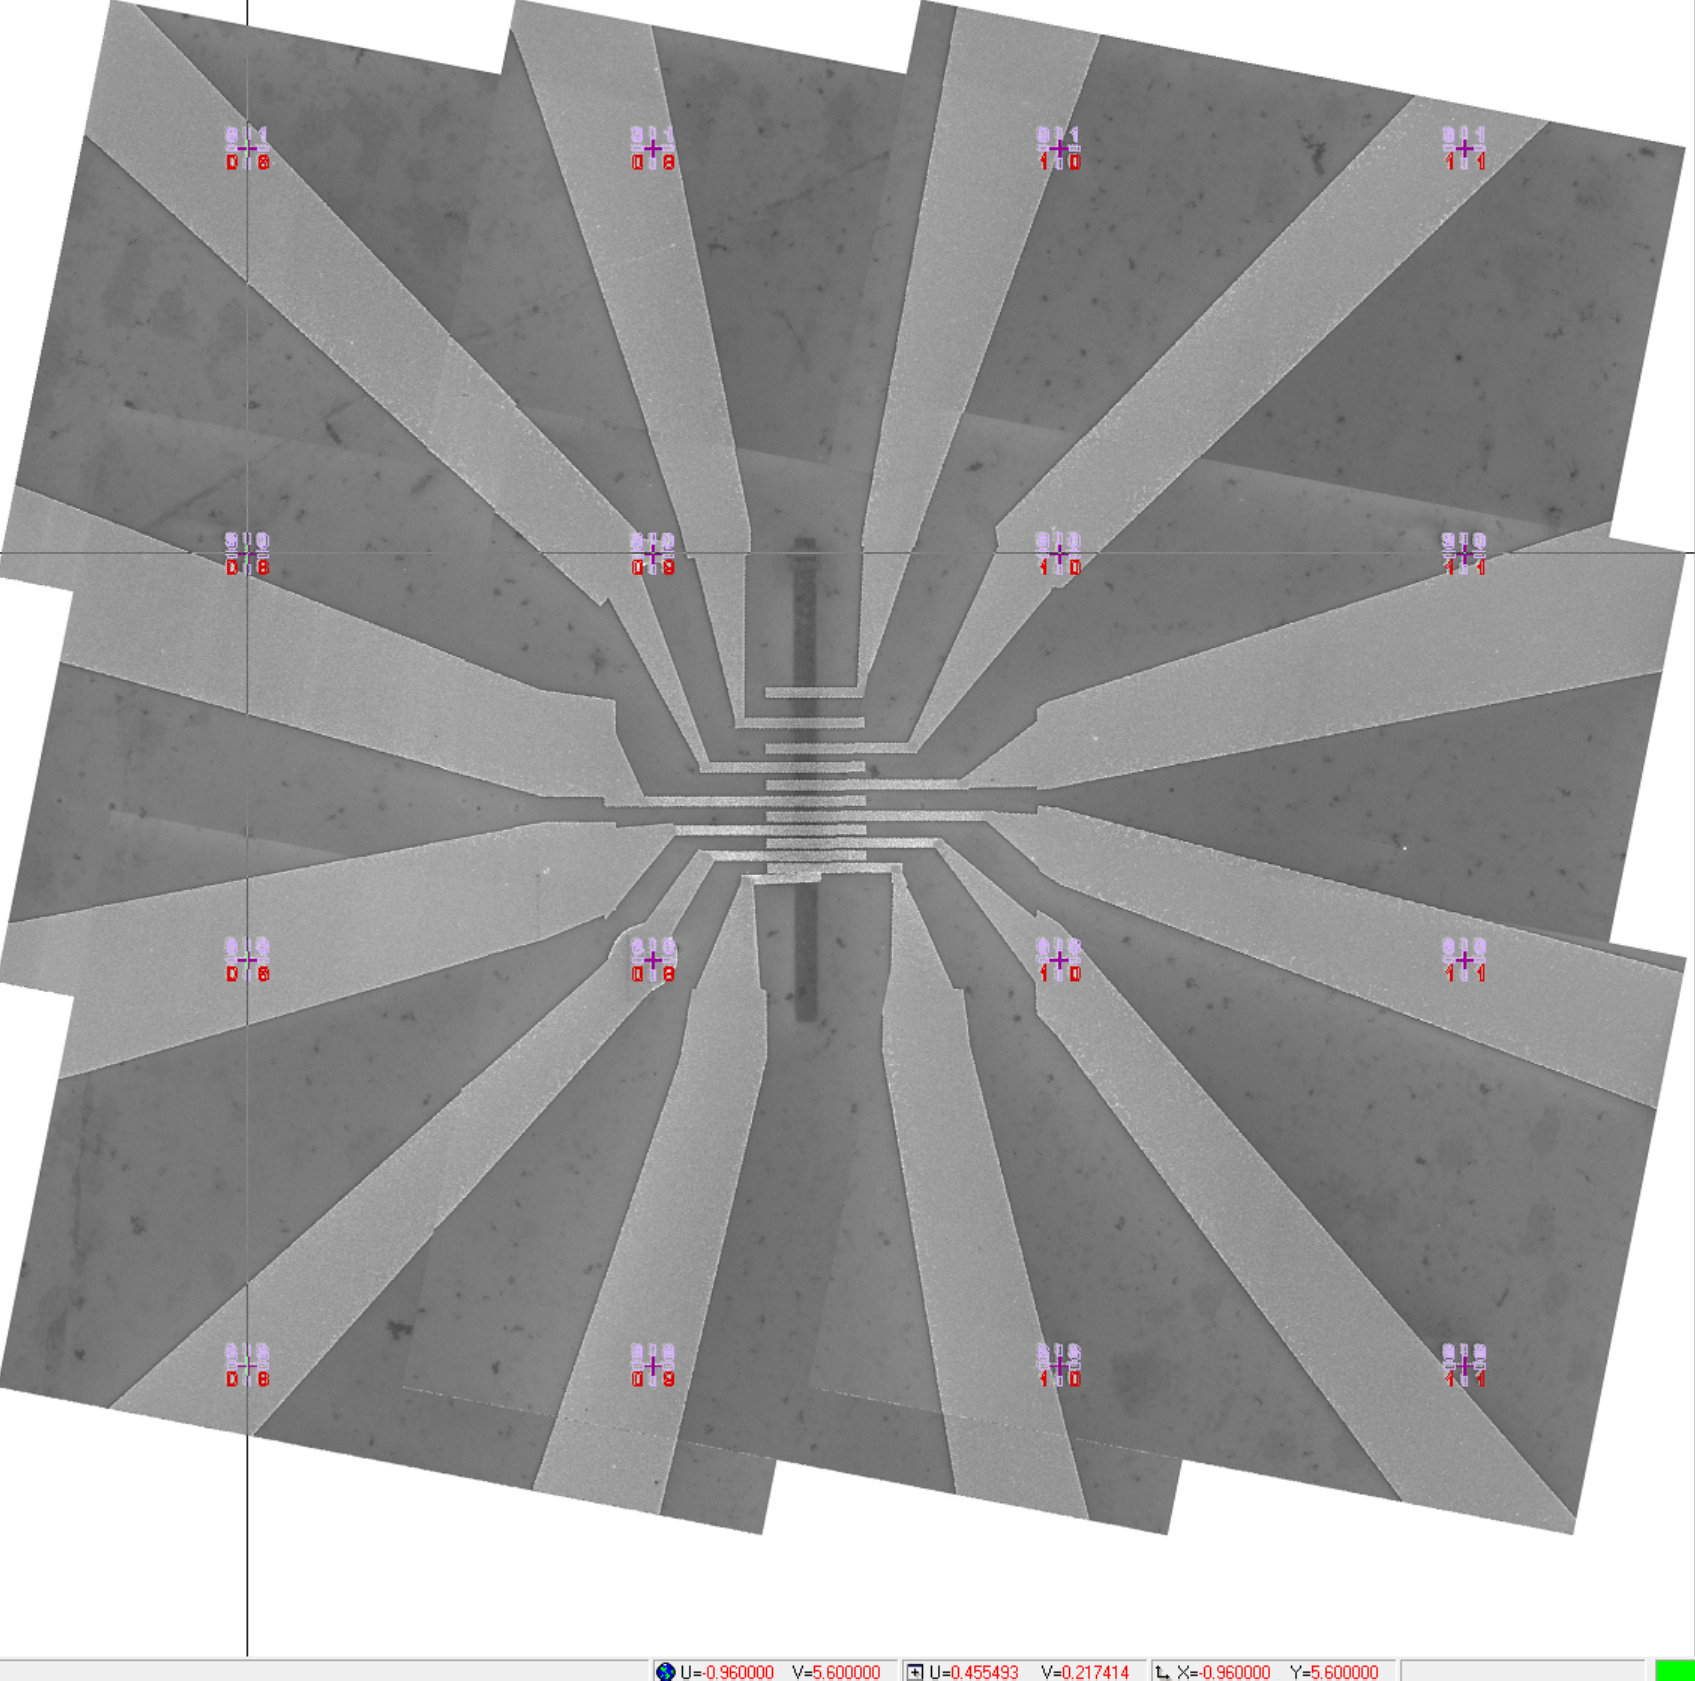
To show the transformed image in the design file, click on the design file window to bring it to the foreground, and then click "Options" → "Show Video". The transformed mosaic image will appear in the design file, as shown in Figure 16.
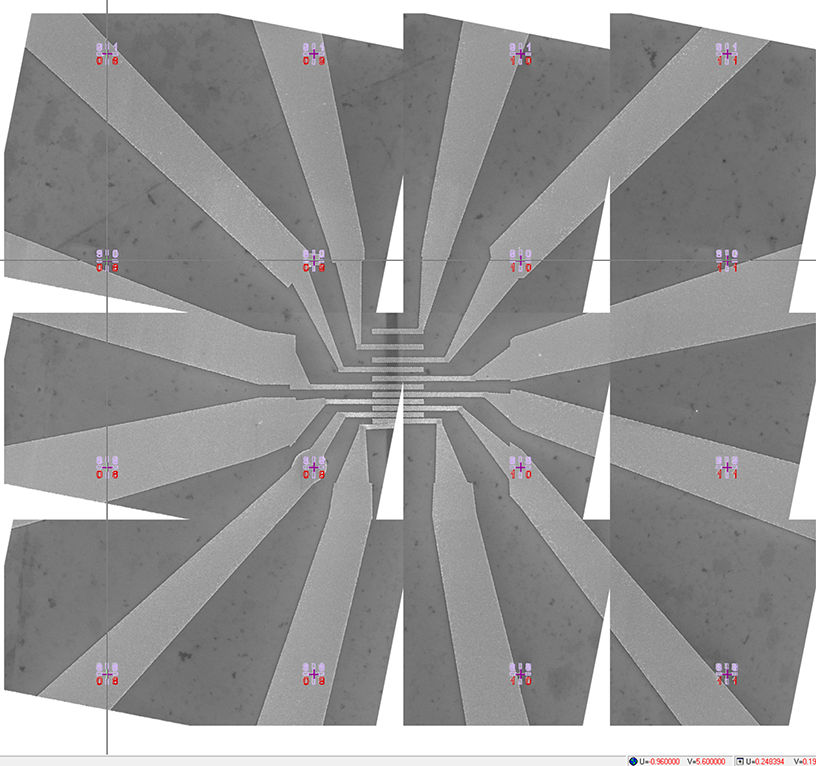
Figure 16. The transformed mosaic SEM image displayed in the design file. The white triangles within the image are a result of a significant (deliberate) rotation of the individual images. It is recommended to capture the images with the smallest possible rotation. Notice that the cursor is positioned at the center of the lower-left mark in the top-left image. The coordinates of the cursor are (-0.96 mm, 5.6 mm), which correspond to the coordinates of the lower-left mark shown in Figure 4.
In the table at the bottom of the window shown in Figure 5, SVGMarks lists all images found in the folder containing the reference image. If the images to be transformed are in a different folder, click the 'Open' button in the upper-right corner to browse for one of the images you want to transform. Once an image is selected, its folder will be used.
The table has the following columns:
Notice the offsets 'ΔX (X pitch)' and 'ΔY (Y pitch)' in the 'Horizontal Offset' group box (Figure 9). Mathematically, the microscope stage translation vector in the horizontal direction (after transformation) is given as (79.99 µm, 0.016 µm) ≈ (80 µm, 0 µm), which matches the values used to scan the images (see Figure 3).
The result of the horizontal calibration was saved in a file with the automatically generated filename "HCal_11_t01_12_t01.svg", as shown in Figure 10. It is recommended to keep the default filename, as this allows the horizontal calibration to be automatically loaded when the "Stitch" window is opened next time. Additionally, if another set of images was taken using the same horizontal stage translation vector, this calibration can be reused by opening the file "HCal_11_t01_12_t01.svg" through the "Open" button (i.e., another calibration is not necessary in this case).

This completes the measurement of the horizontal offset. To determine the vertical offset between images, repeat the same procedure in the vertical direction, as described below.
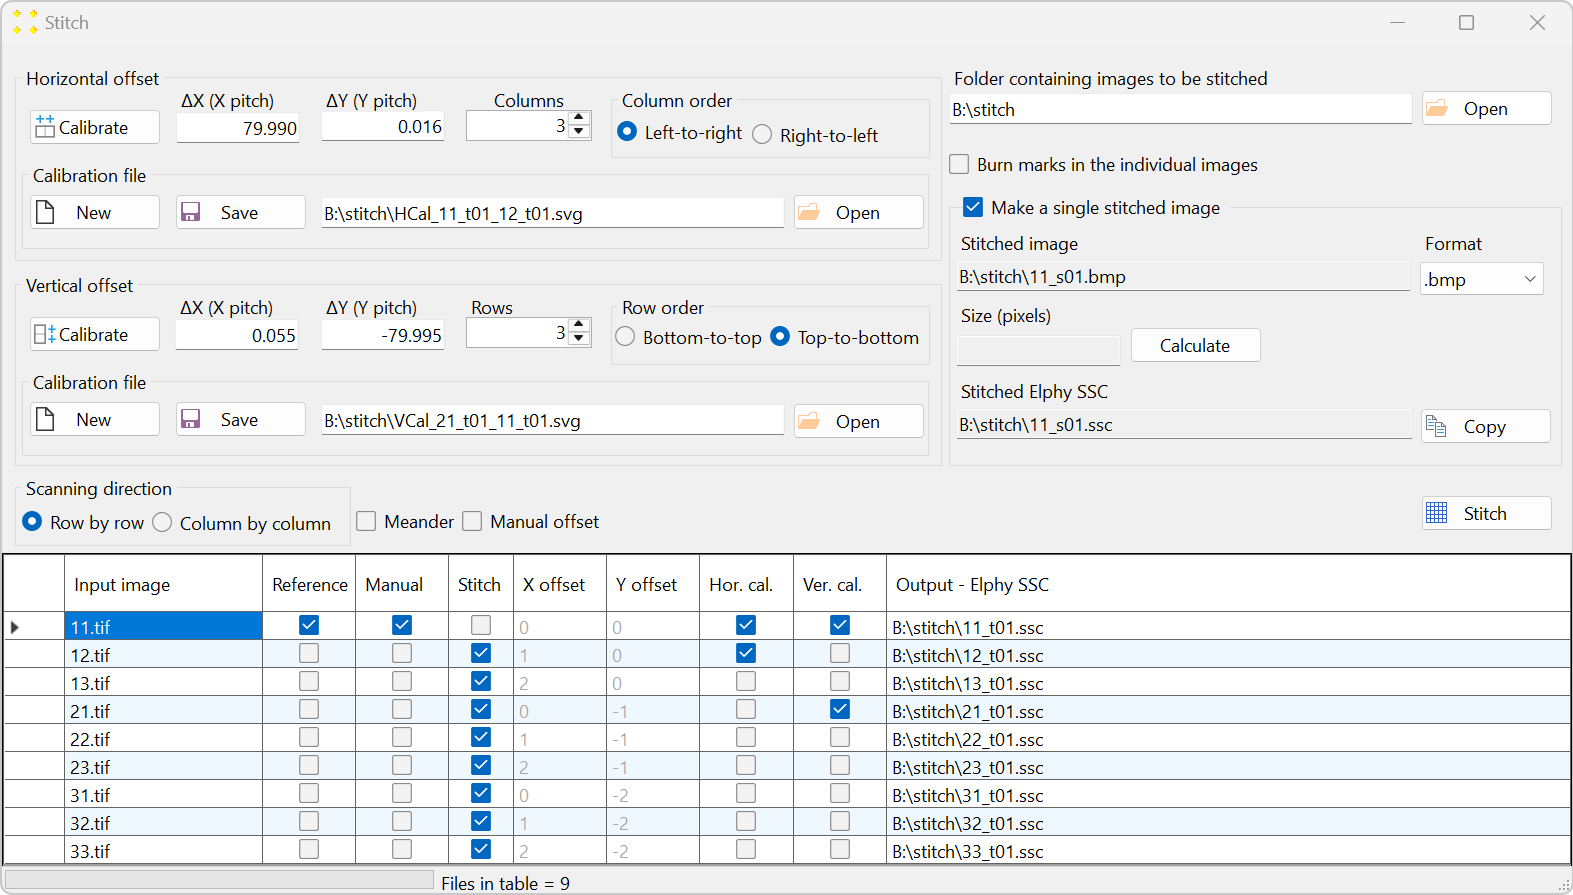
Notice the offsets "ΔX (X pitch)" and "ΔY (Y pitch)" in the "Vertical offset" group box (Figure 13). The vertical offset was calculated based on mark positioning. Mathematically, the microscope stage translation vector in the vertical direction (after transformation) is given as (0.055 µm, -79.995 µm) ≈ (0 µm, 80 µm), which matches the values used to scan the images (see Figure 3).
The result of the vertical calibration was saved in a file with the automatically generated filename "VCal_21_t01_11_t01.svg", as shown in Figure 14. It is recommended to keep the default filename, as this allows the vertical calibration to be automatically loaded when the "Stitch" window is opened next time. Additionally, if another set of images was taken using the same vertical stage translation vector, this calibration can be reused by opening the file "VCal_21_t01_11_t01.svg" through the "Open" button (i.e., another calibration is not necessary in this case).

Figure 14 displays the "Stitch" window at the end of the calibration.
Transformation after stitching
In the transformation-after-stitching approach, the (distorted) images are first stitched together into a (distorted) mosaic image, as described in Untransformed images. The mosaic image is then transformed to correct distortion, as described in Single image. The transformed mosaic image can then be opened in the design file. The complete procedure is performed on the same 9 images used in the previous example (shown in Figure 1) and is described in detail below.
-
Open one of the images in SVGMarks. The choice of the initial image is arbitrary, but for simplicity, it is recommended to start with the first image captured by the microscope, which in this case is "11.tif". This image will be referred to as the reference image and is shown in Figure 17.

Figure 17. The reference image opened for stitching. Optionally, the ".jpg" file format can be selected in the "Format" combo box because this image (after native transformation) will not be opened in Raith Nanosuite. -
Click the "Native" button to perform the native transformation of the image. This will automatically position the three default marks at the exact corners of the image, as shown in Figure 18. Their coordinates are set to match the image size in pixels. In this case, the coordinates are Xmax = 1024 and Ymax = 768. The automatic native transformation is necessary to define the image size, which is essential for stitching all captured images into a single mosaic image.
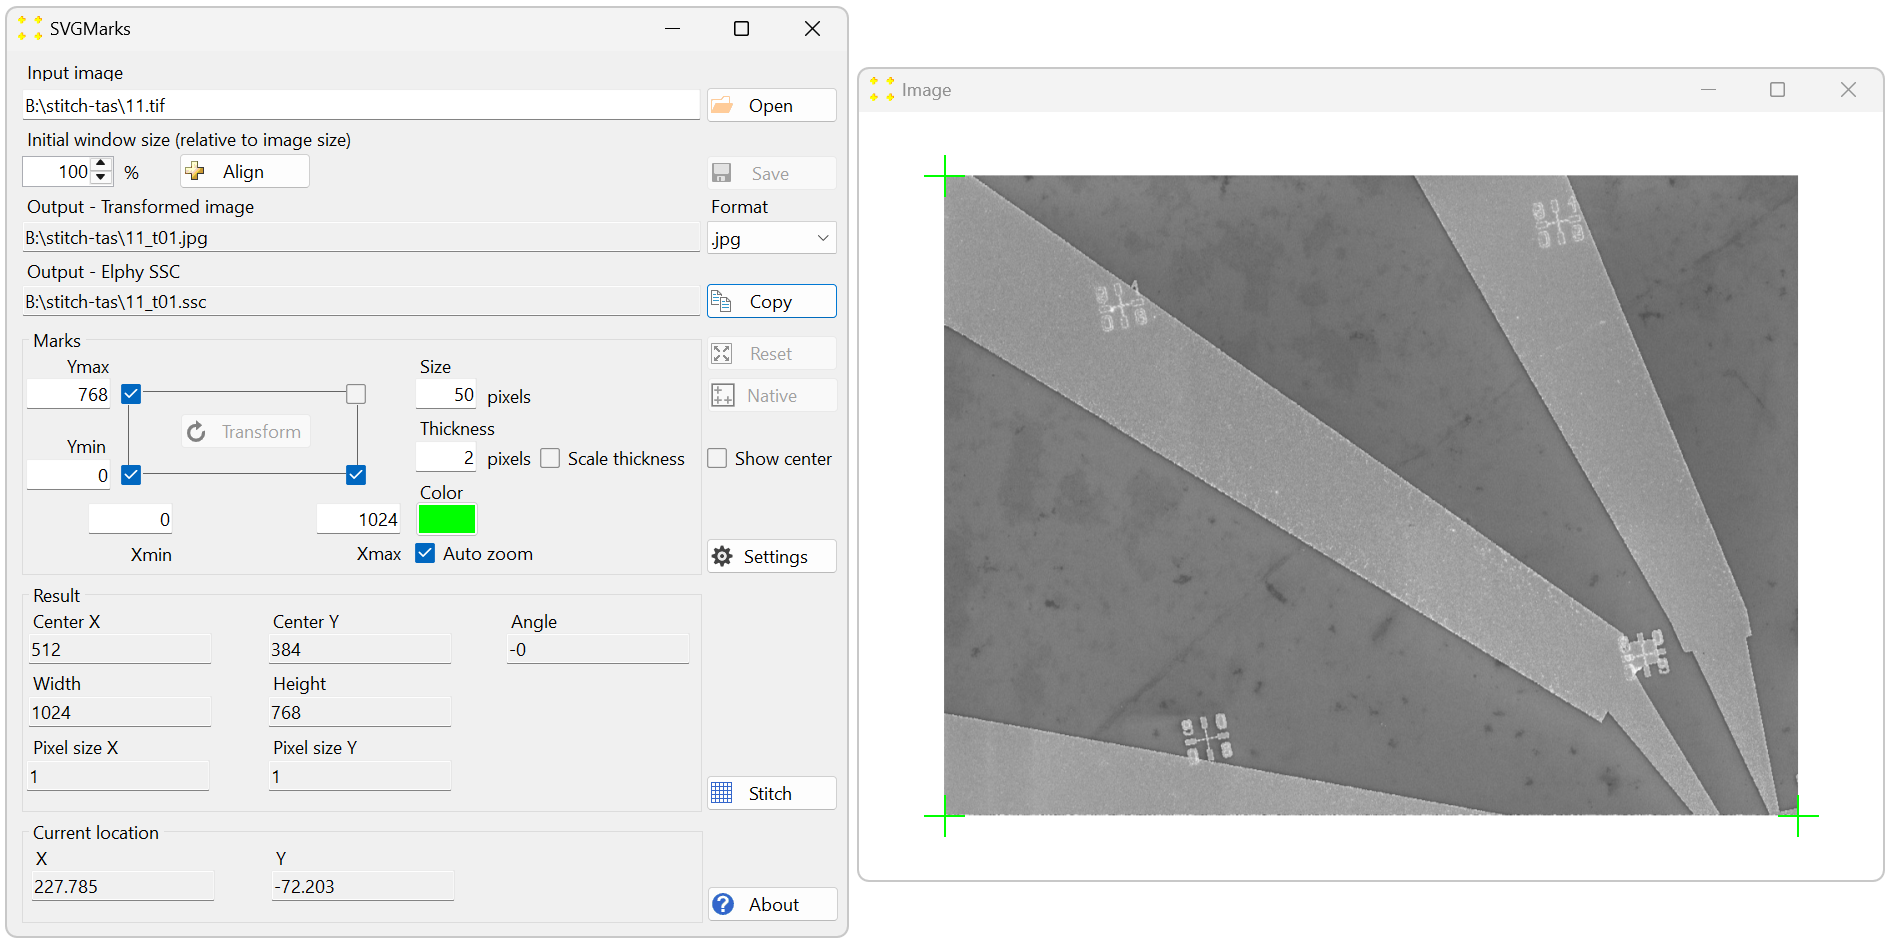
Figure 18. The result of the native transformation of the image "11.tif." The image is zoomed out (using the mouse scroll wheel) to reveal the three default marks positioned at the exact corners of the image. -
Click the "Stitch" button to open the "Stitch" window, as shown in Figure 19. All 9 images are listed in the table in alphabetical order, which follows the typical naming convention for images captured by a microscope. The settings in the "Stitch" window should be configured so that the alphabetical order in the table aligns with the scanning pattern used to capture the images, as illustrated in Figure 2. The parameters in Figure 19 are already set, as they are identical to those in Figure 5. The only difference is that the file extension in the "Format" combo box is changed to ".jpg" to reduce the size of the mosaic image, as this image will not be opened in the design file prior to transformation.
-
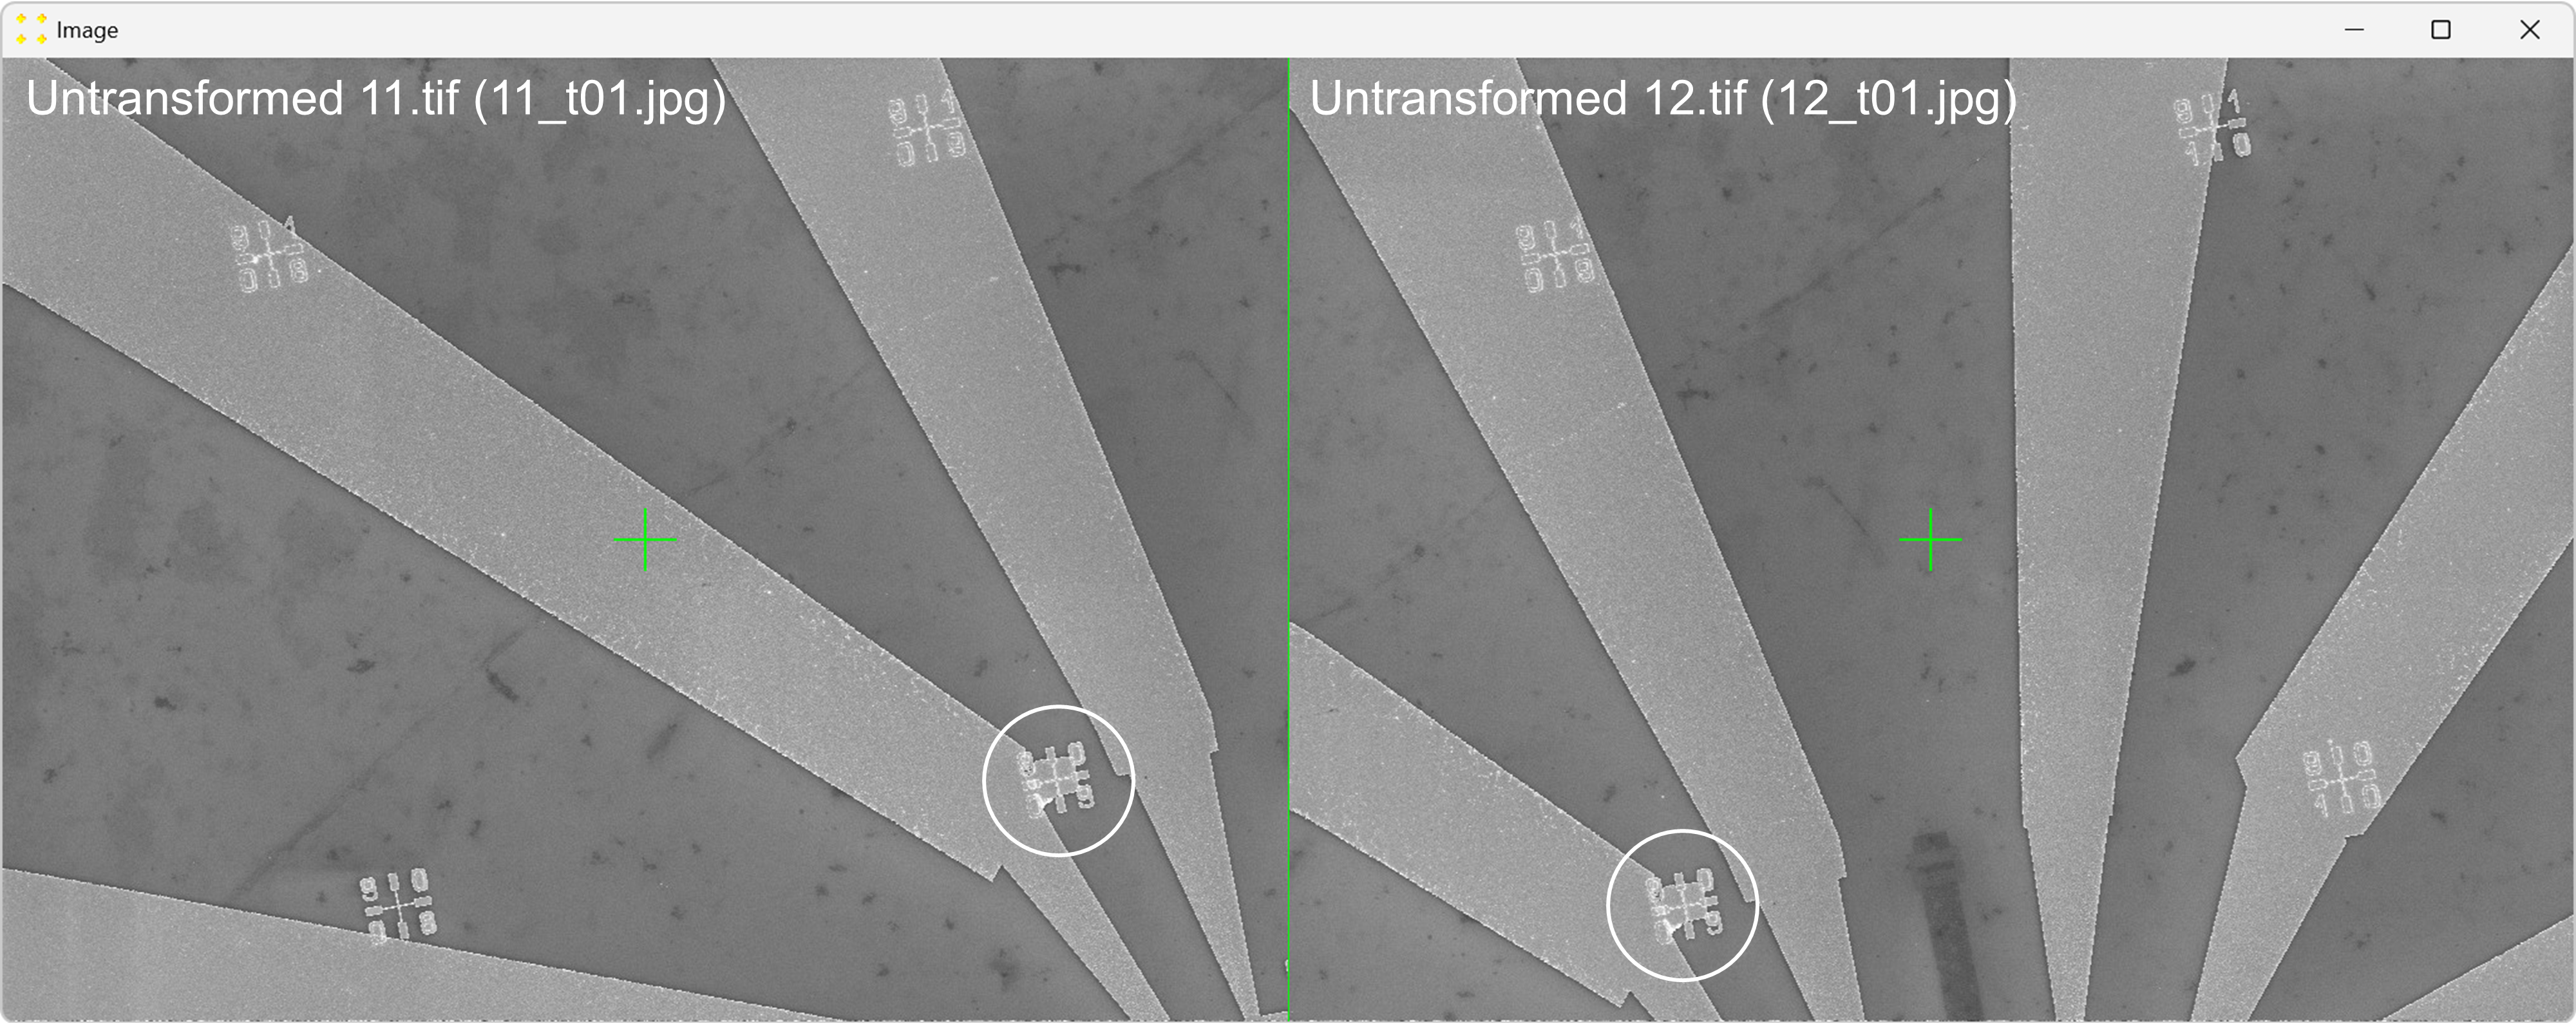
Click the "Calibrate" button in the "Horizontal offset" group box to open the images used to determine the horizontal offset between neighboring images. This will display the untransformed images "11.tif" and "12.tif" side by side, each with a single mark at its center, as shown in Figure 20. The images are separated by a line of the same color and thickness as the marks. The image "12.tif" is displayed to the right of the image "11.tif", which corresponds to the selected settings in the "Stitch" window (based on Figure 2).
Roughly align the marks with the fabricated Au mark visible in their respective images, as shown in Figure 21.
Double-click the marks to zoom in and precisely align them with the common Au mark, as shown in Figure 22. The zoom-in procedure is explained in detail in Single Image.
Close the window with the images and save your changes.
Click the "Calibrate" button in the "Vertical Offset" group box to open the images used to determine the vertical offset between neighboring images. This action will display the untransformed images "11.tif" and "21.tif" stacked vertically, each with a single mark at its center, as shown in Figure 24. The images are separated by a line of the same color and thickness as the marks. The image "21.tif" appears below "11.tif", reflecting the selected settings in the "Stitch" window (based on Figure 2).
Roughly align the marks with the common feature visible in their respective images, as shown in Figure 12.
Double-click the marks to zoom in and precisely align them with the common feature, as shown in Figure 13. The zoom-in procedure is explained in detail in Single image.
Close the window with the images and save your changes.
Click the "Stitch" button, shown in Figure 28, to perform stitching. This action will save the stitched mosaic image in the file "11_s01.jpg". The mosaic file is shown in Figure 29. The mosaic image displays a graphene electronic device.
-
Close the "Stitch" window and return to the main window of SVGMarks, as shown in Figure 30.
-
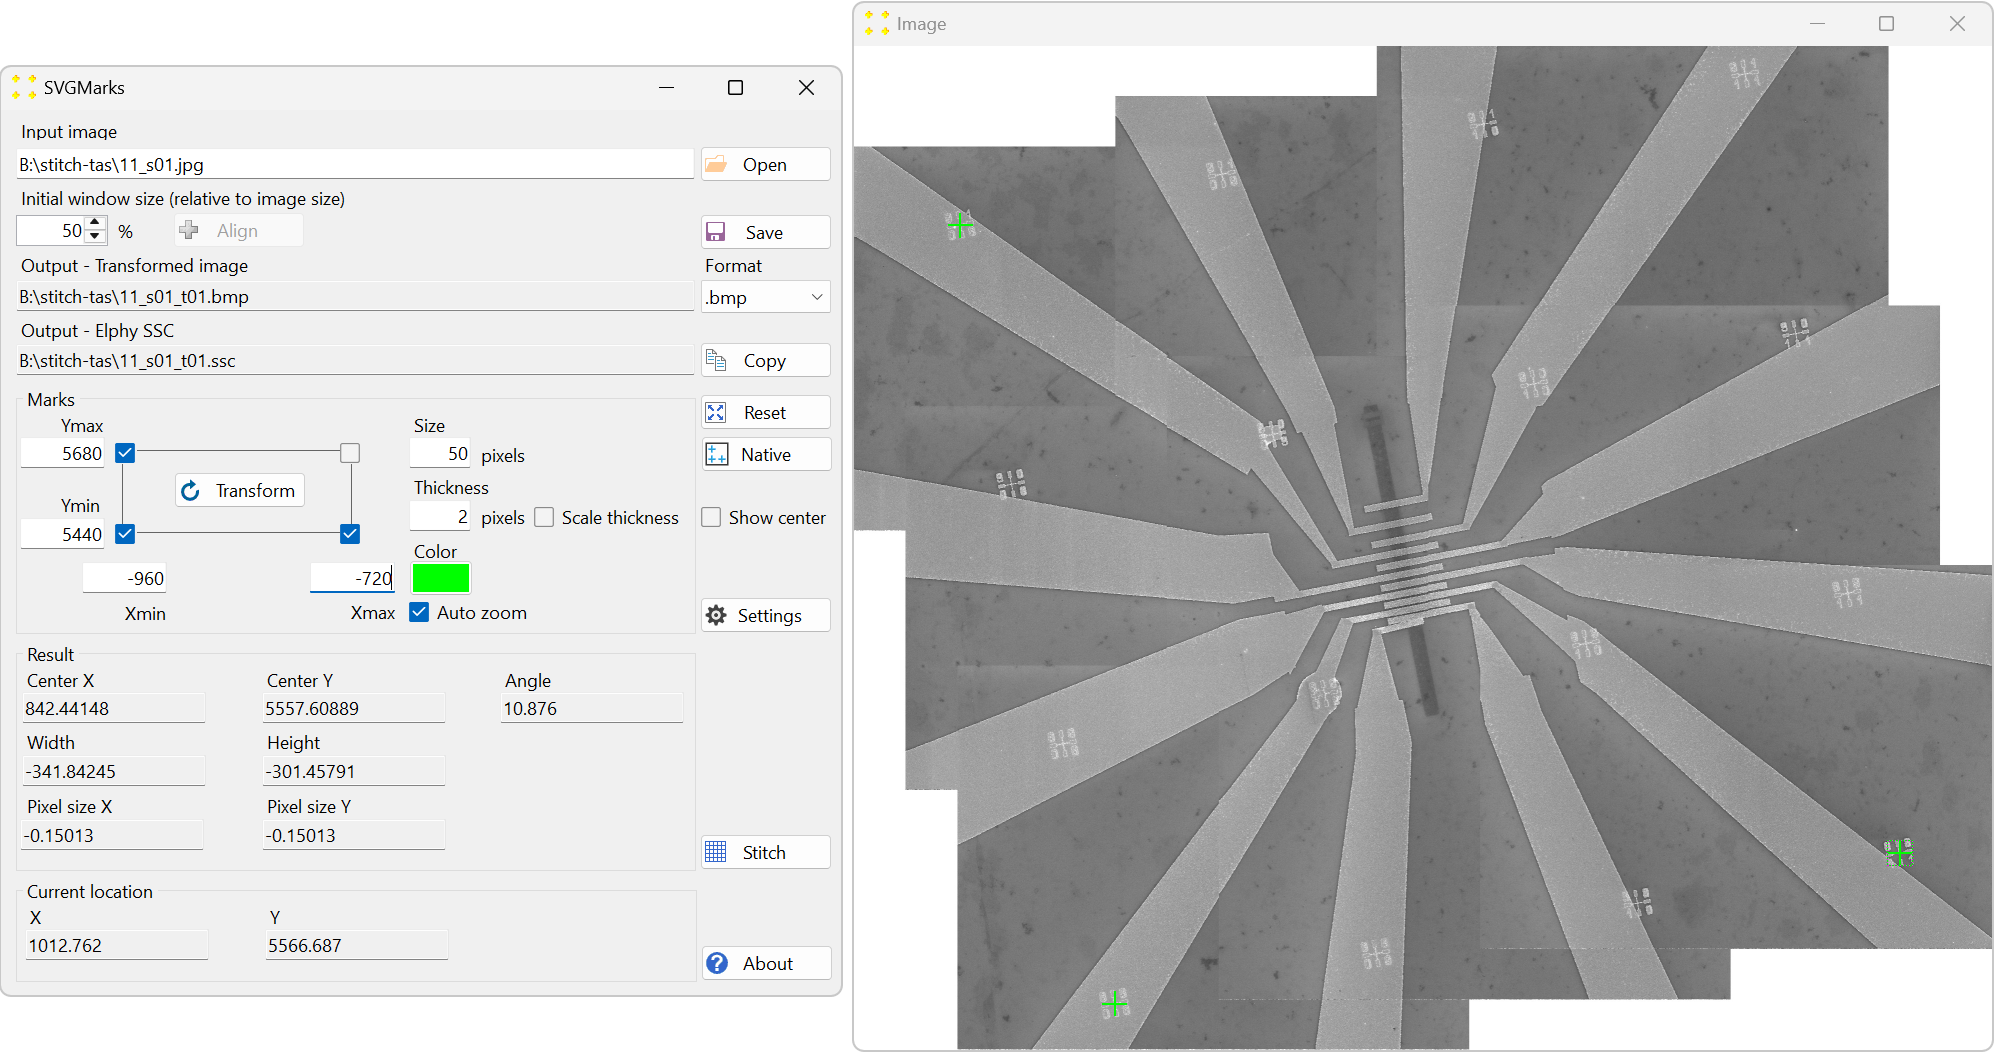
Click the "Open" button and open the newly created mosaic image "11_s01.jpg". It is advisable to set the "Initial window size (relative to image size)" numeric box to 50% due to the large size of the mosaic image. This is also illustrated in Figure 30.
Insert the coordinates of three selected marks, as shown in in Figure 30. In this case, the coordinates are Xmin = -960, Xmax = -720, Ymin = 5440, and Ymax = 5680, as these represent the positions of the marks in µm.
Click the "Transform" button to correct the image distortion. Ensure that the ".bmp" format is selected in the "Format" combo box, as Raith Nanosuite only supports this image format. This will create the corrected image "11_s01_t01.bmp," as shown in Figure 31.
Click the "Copy" button to copy the file name of the SSC file. SVGMarks can now be closed if it is not needed.
- Open the design file in Raith Nanosuite. To open the transformed image, click on "File" → "Open image..." and paste the file name you copied above into the "File name" text box of the "Open Image" dialog. Click "Open" to open the transformed image.
To show the transformed mosaic image in the design file, click on the design file window to bring it to the foreground, and then click "Options" → "Show Video". The transformed image will appear in the design file, as shown in Figure 32.
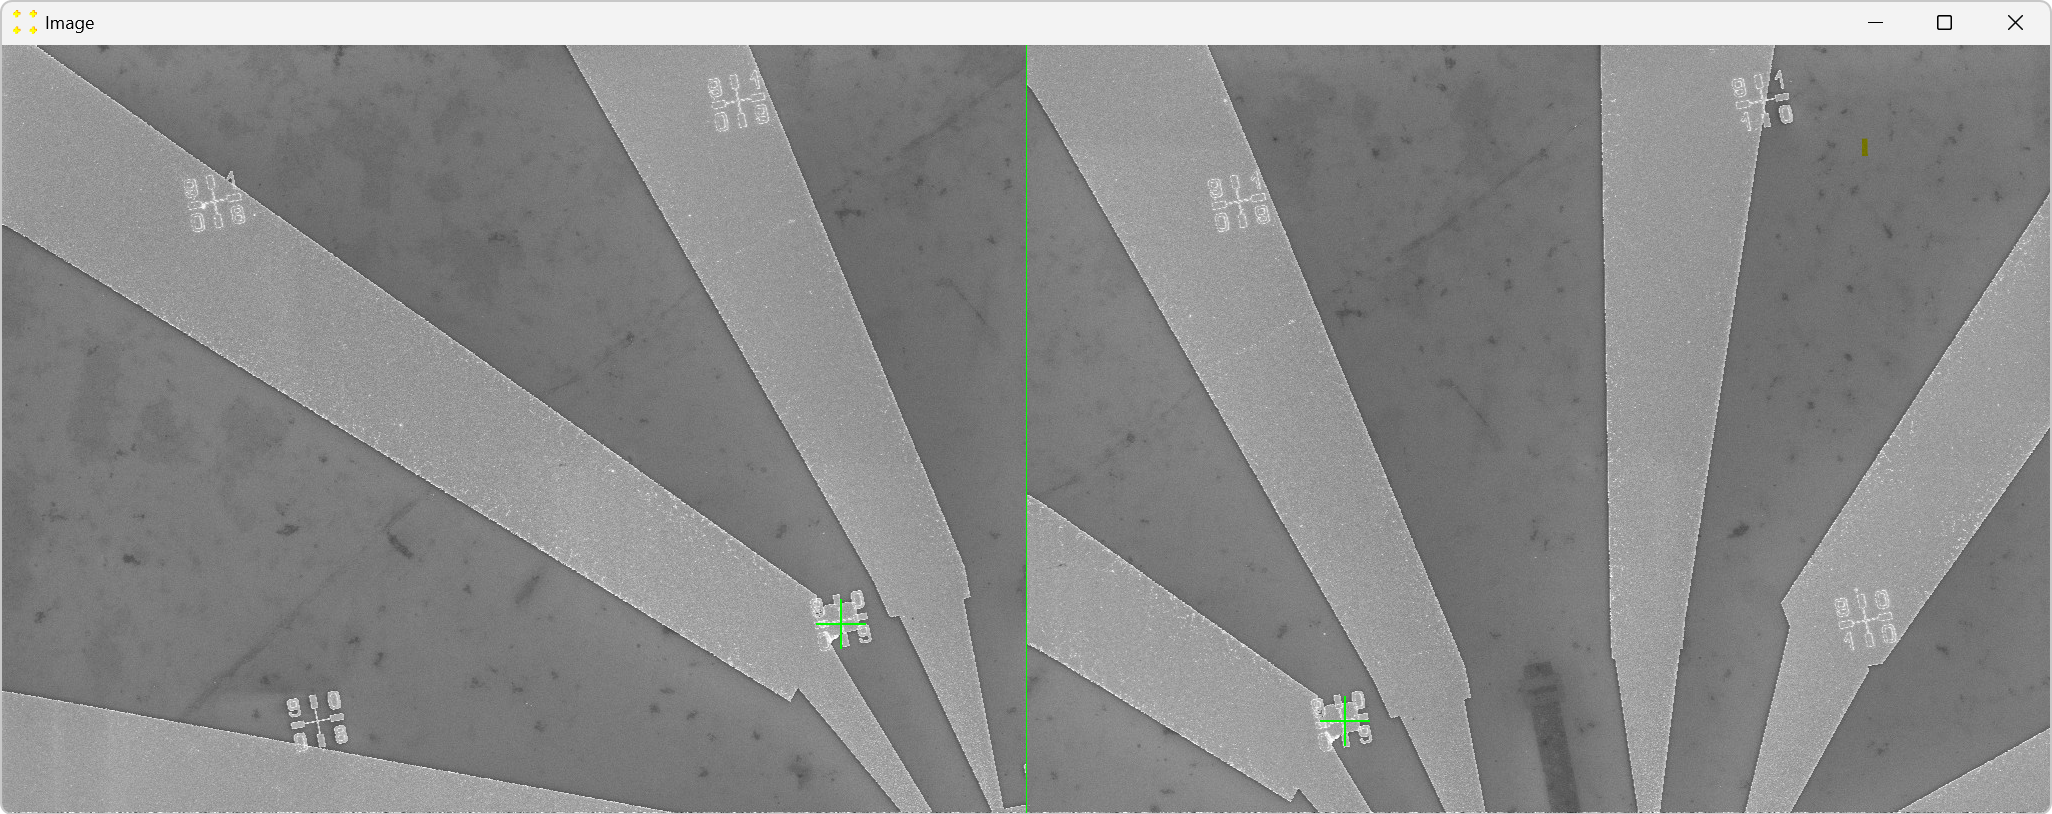
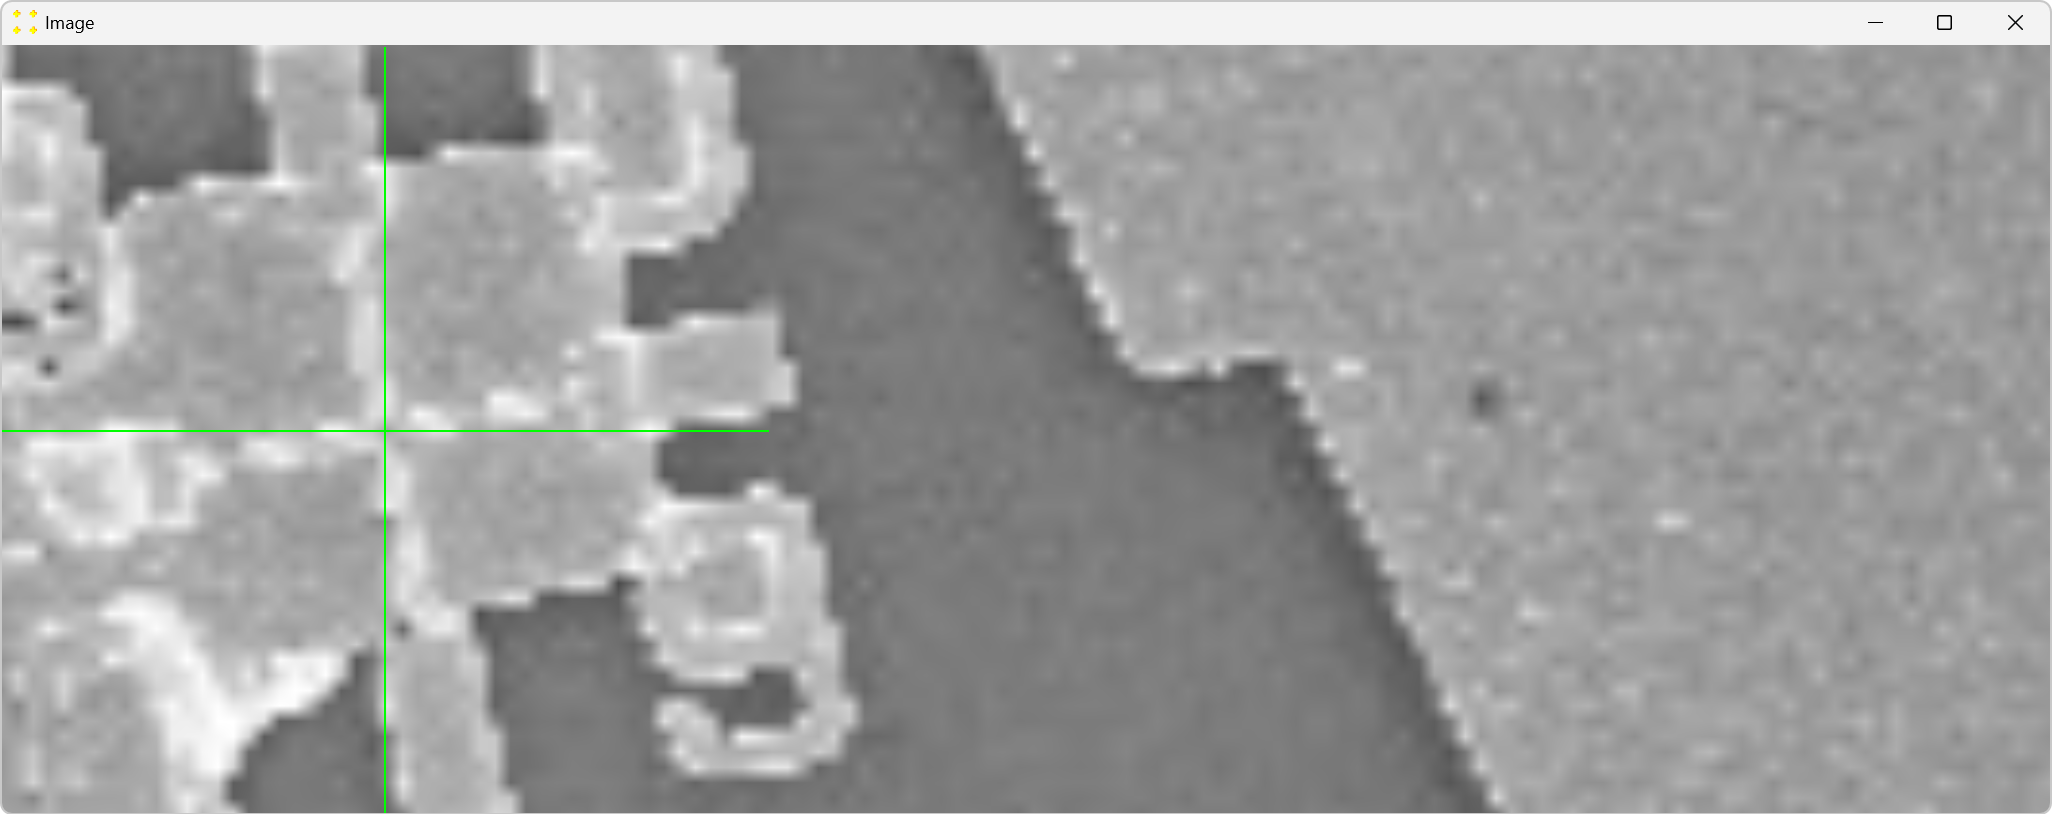
Notice the offsets "ΔX (X pitch)" and "ΔY (Y pitch)" in the "Horizontal offset" group box (Figure 23). The horizontal offset was calculated based on mark positioning and does not need to be strictly in the horizontal direction, i.e., parallel to the x-axis.
Mathematically, the microscope stage translation vector in the horizontal direction is given in pixels as (523.320, 100.711). This means the horizontal translation vector is not parallel to the x-axis (see Figure 2).
The result of the horizontal calibration was saved in a file with the automatically generated filename "HCal_11_t01_12_t01.svg", as shown in Figure 23. It is recommended to keep the default filename, as this allows the horizontal calibration to be automatically loaded when the "Stitch" window is opened next time. Additionally, if another set of images was taken using the same horizontal stage translation vector, this calibration can be reused by opening the file "HCal_11_t01_12_t01.svg" through the "Open" button (i.e., another calibration would not be necessary in that case).

This completes the measurement of the horizontal offset. To determine the vertical offset between images, repeat the same procedure in the vertical direction, as described below.
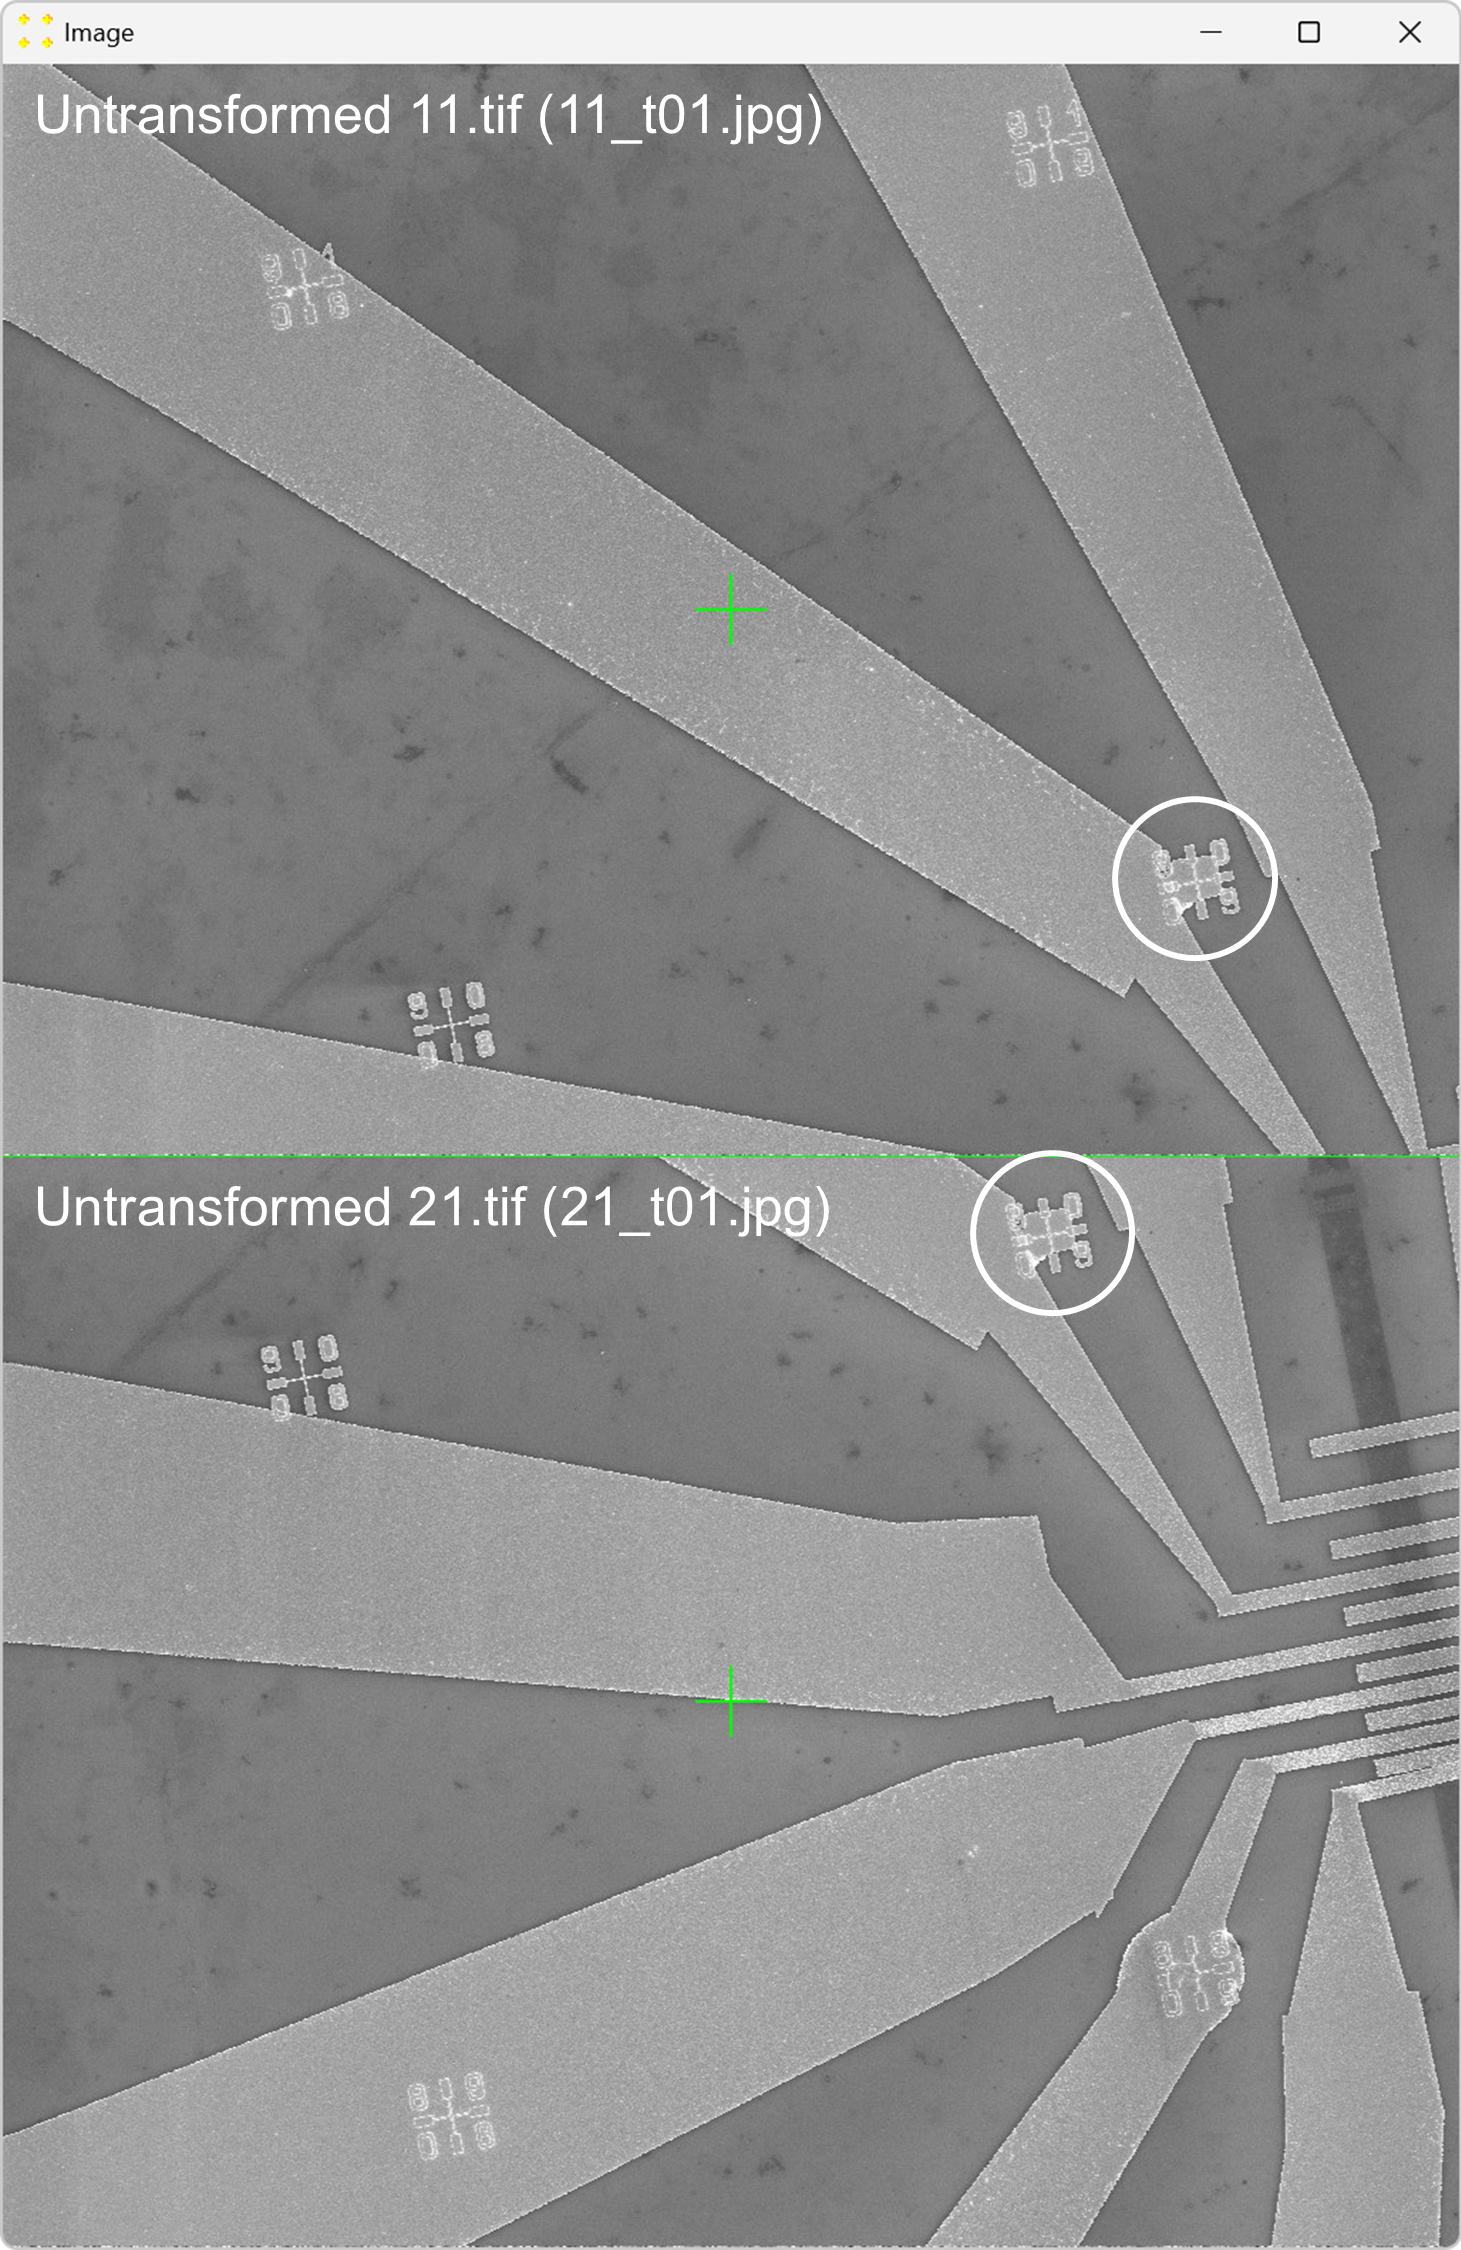
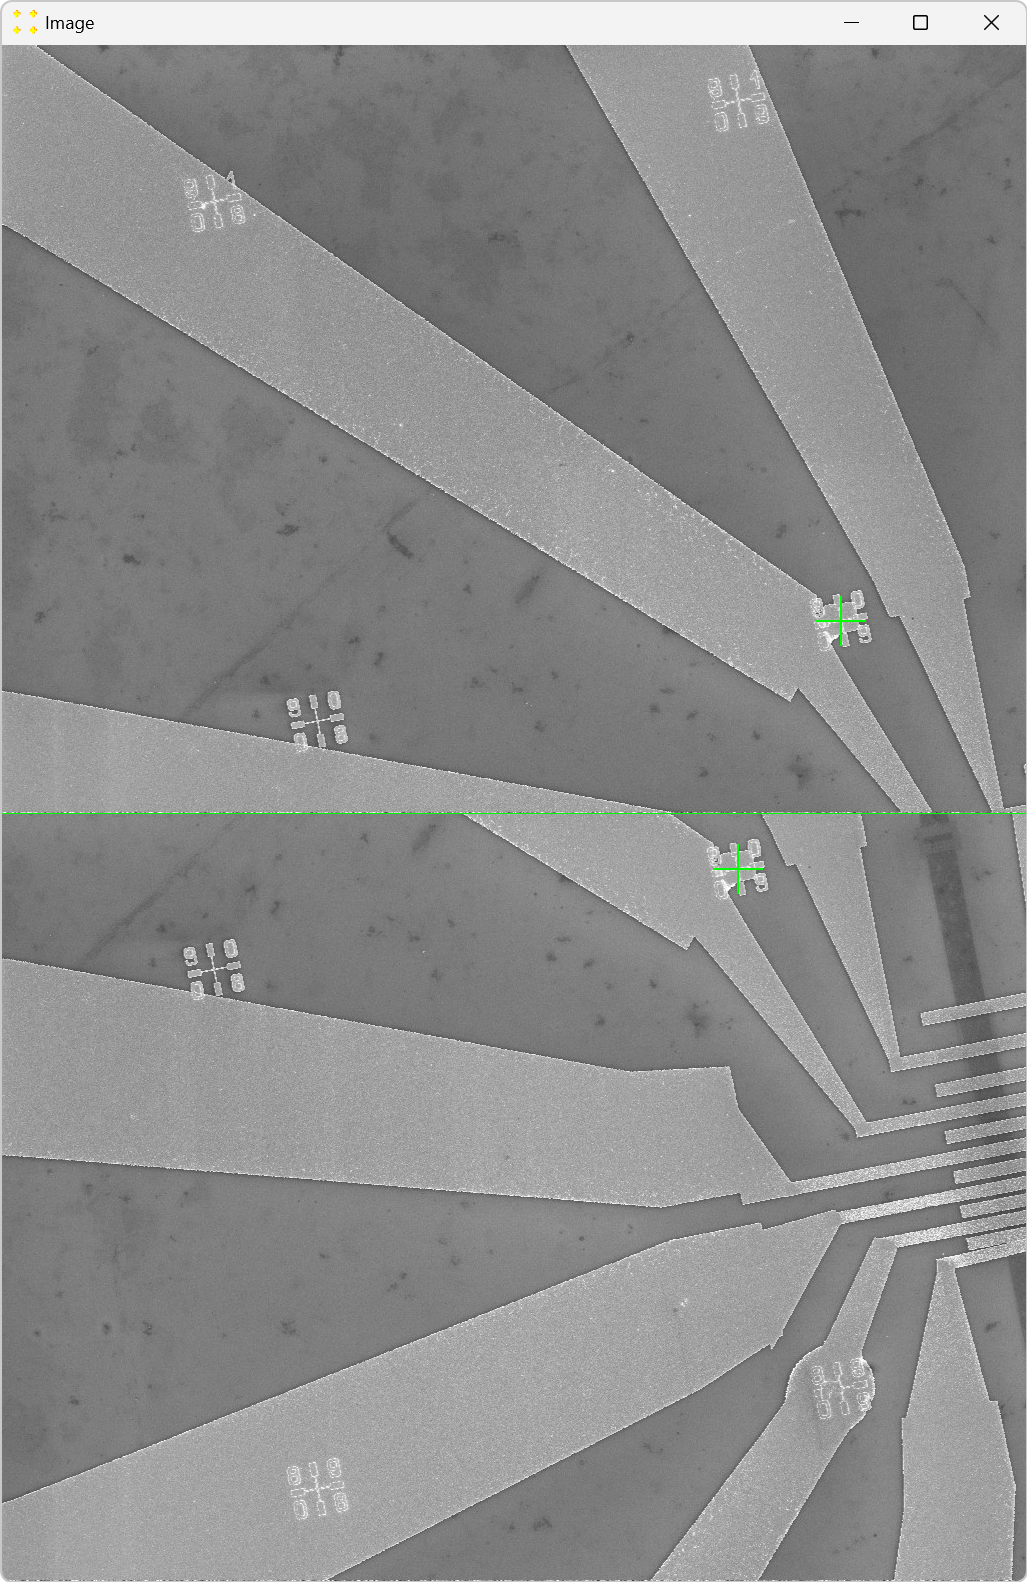
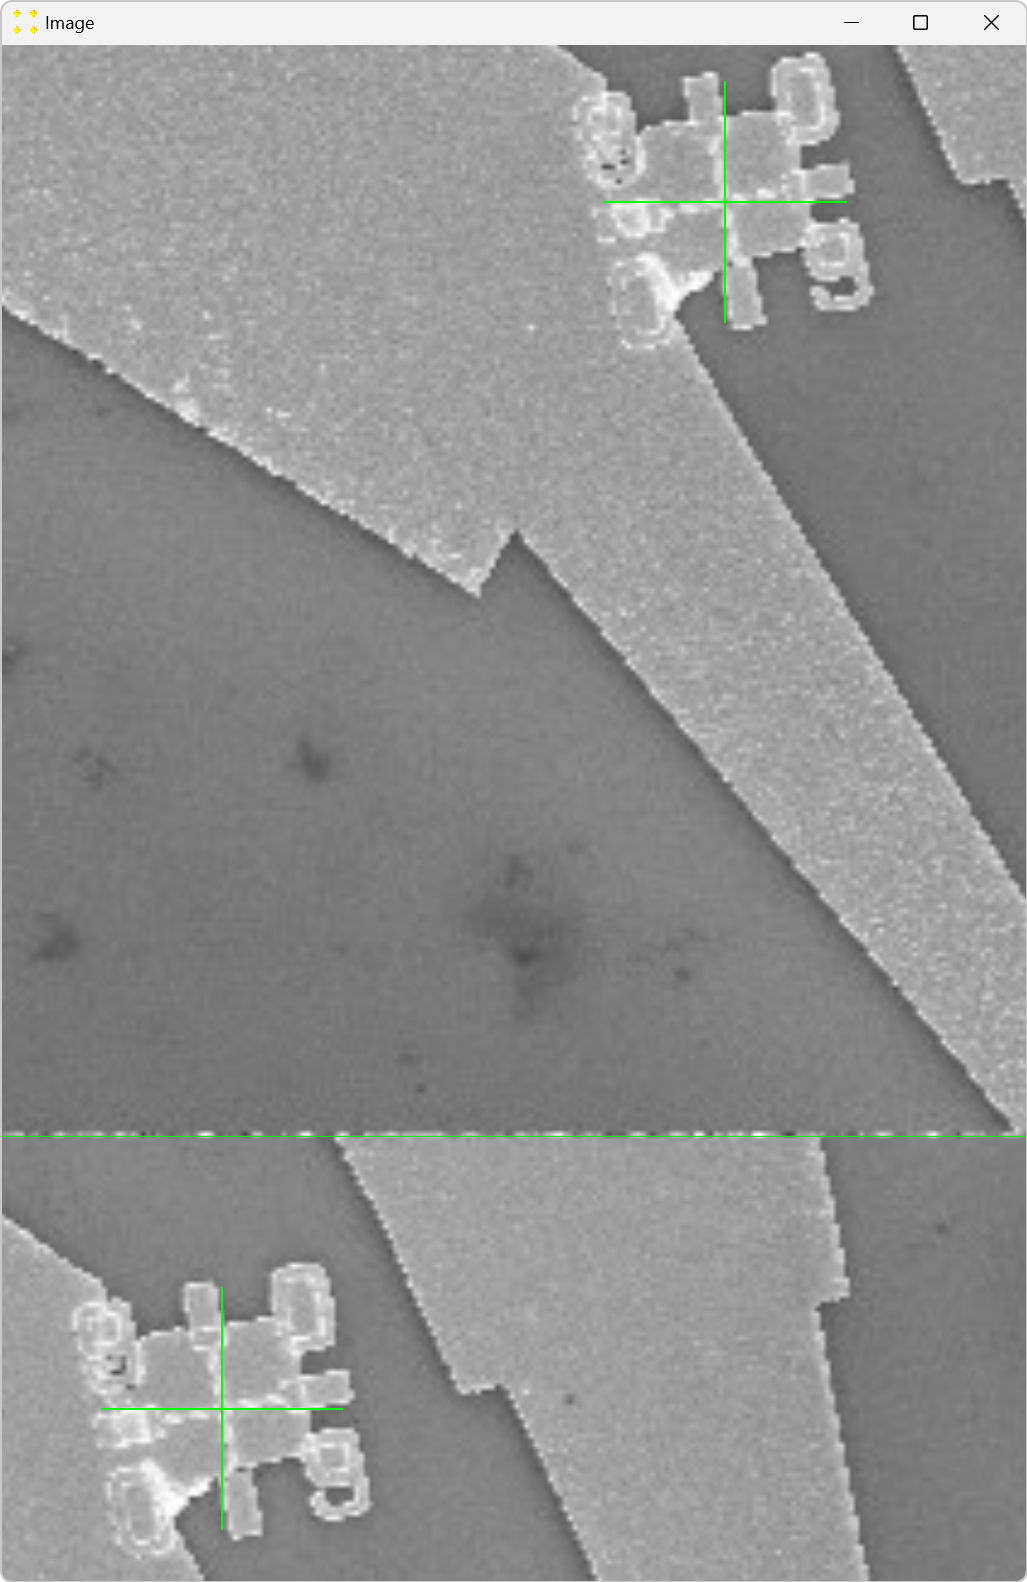
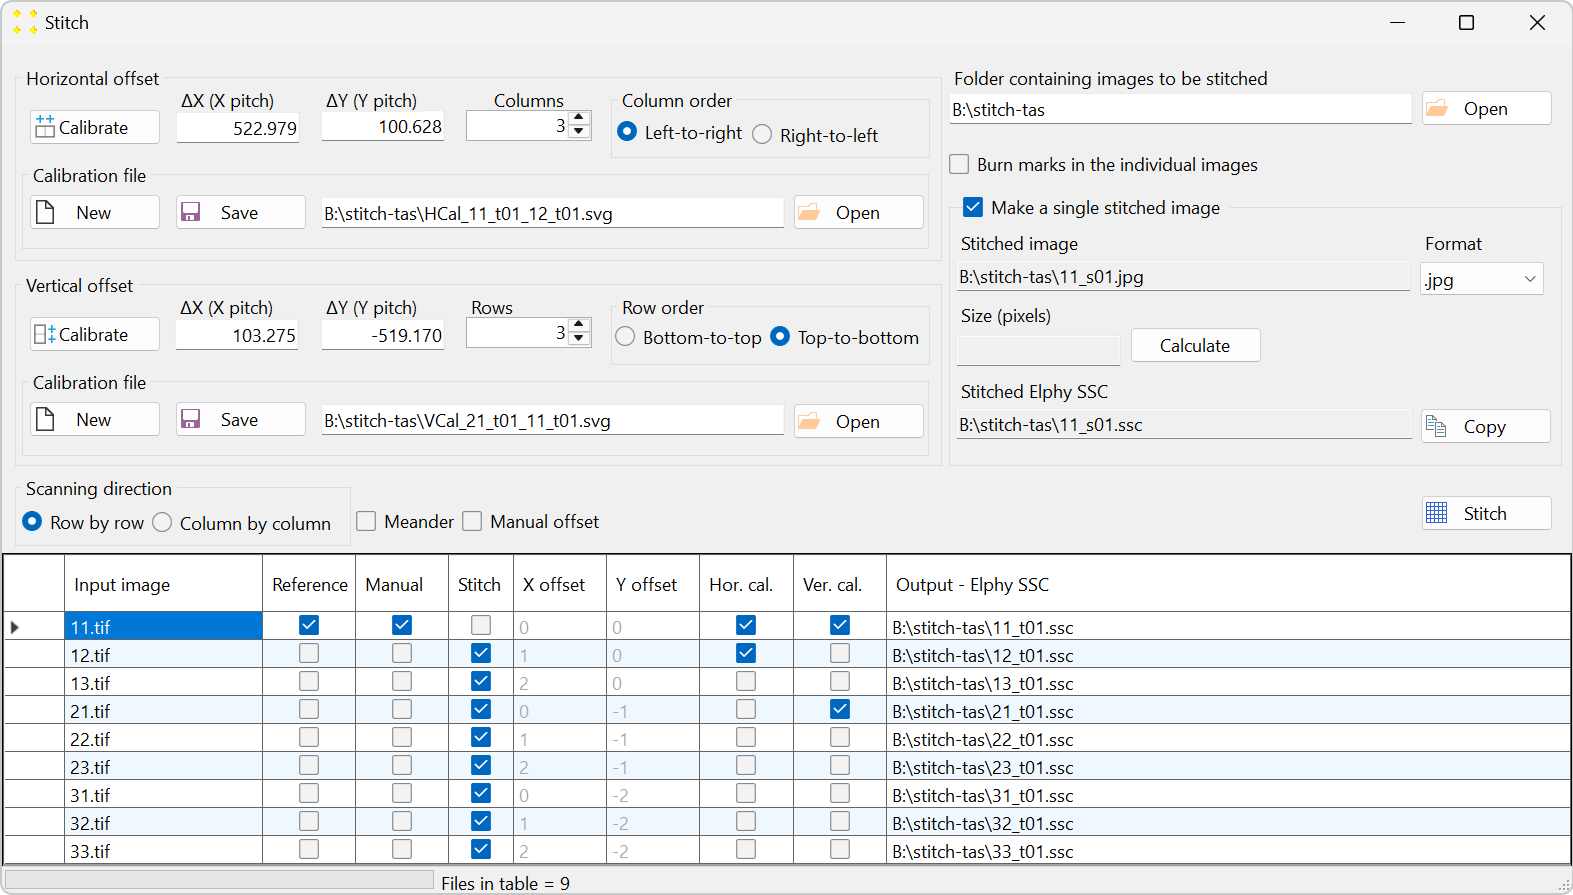
Notice the offsets "ΔX (X pitch)" and "ΔY (Y pitch)" in the "Vertical offset" group box (Figure 27). The vertical offset was calculated based on mark positioning and does not need to be strictly in the vertical direction, i.e., parallel to the y-axis.
Mathematically, the microscope stage translation vector in the vertical direction is given in pixels as (103.275, -519.170). This means the vertical translation vector is not parallel to the y-axis, as can also be understood from Figure 3. SVGMarks can handle arbitrary translation vectors.
The result of the vertical calibration was saved in a file with the automatically generated filename "VCal_21_t01_11_t01.svg", as shown in Figure 28. It is recommended to keep the default filename, as this allows the vertical calibration to be automatically loaded when the "Stitch" window is opened next time. Additionally, if another set of images was taken using the same vertical stage translation vector, this calibration can be reused by opening the file "VCal_21_t01_11_t01.svg" through the "Open" button (i.e., another calibration is not necessary in this case).

Figure 28 displays the "Stitch" window at the end of the calibration.
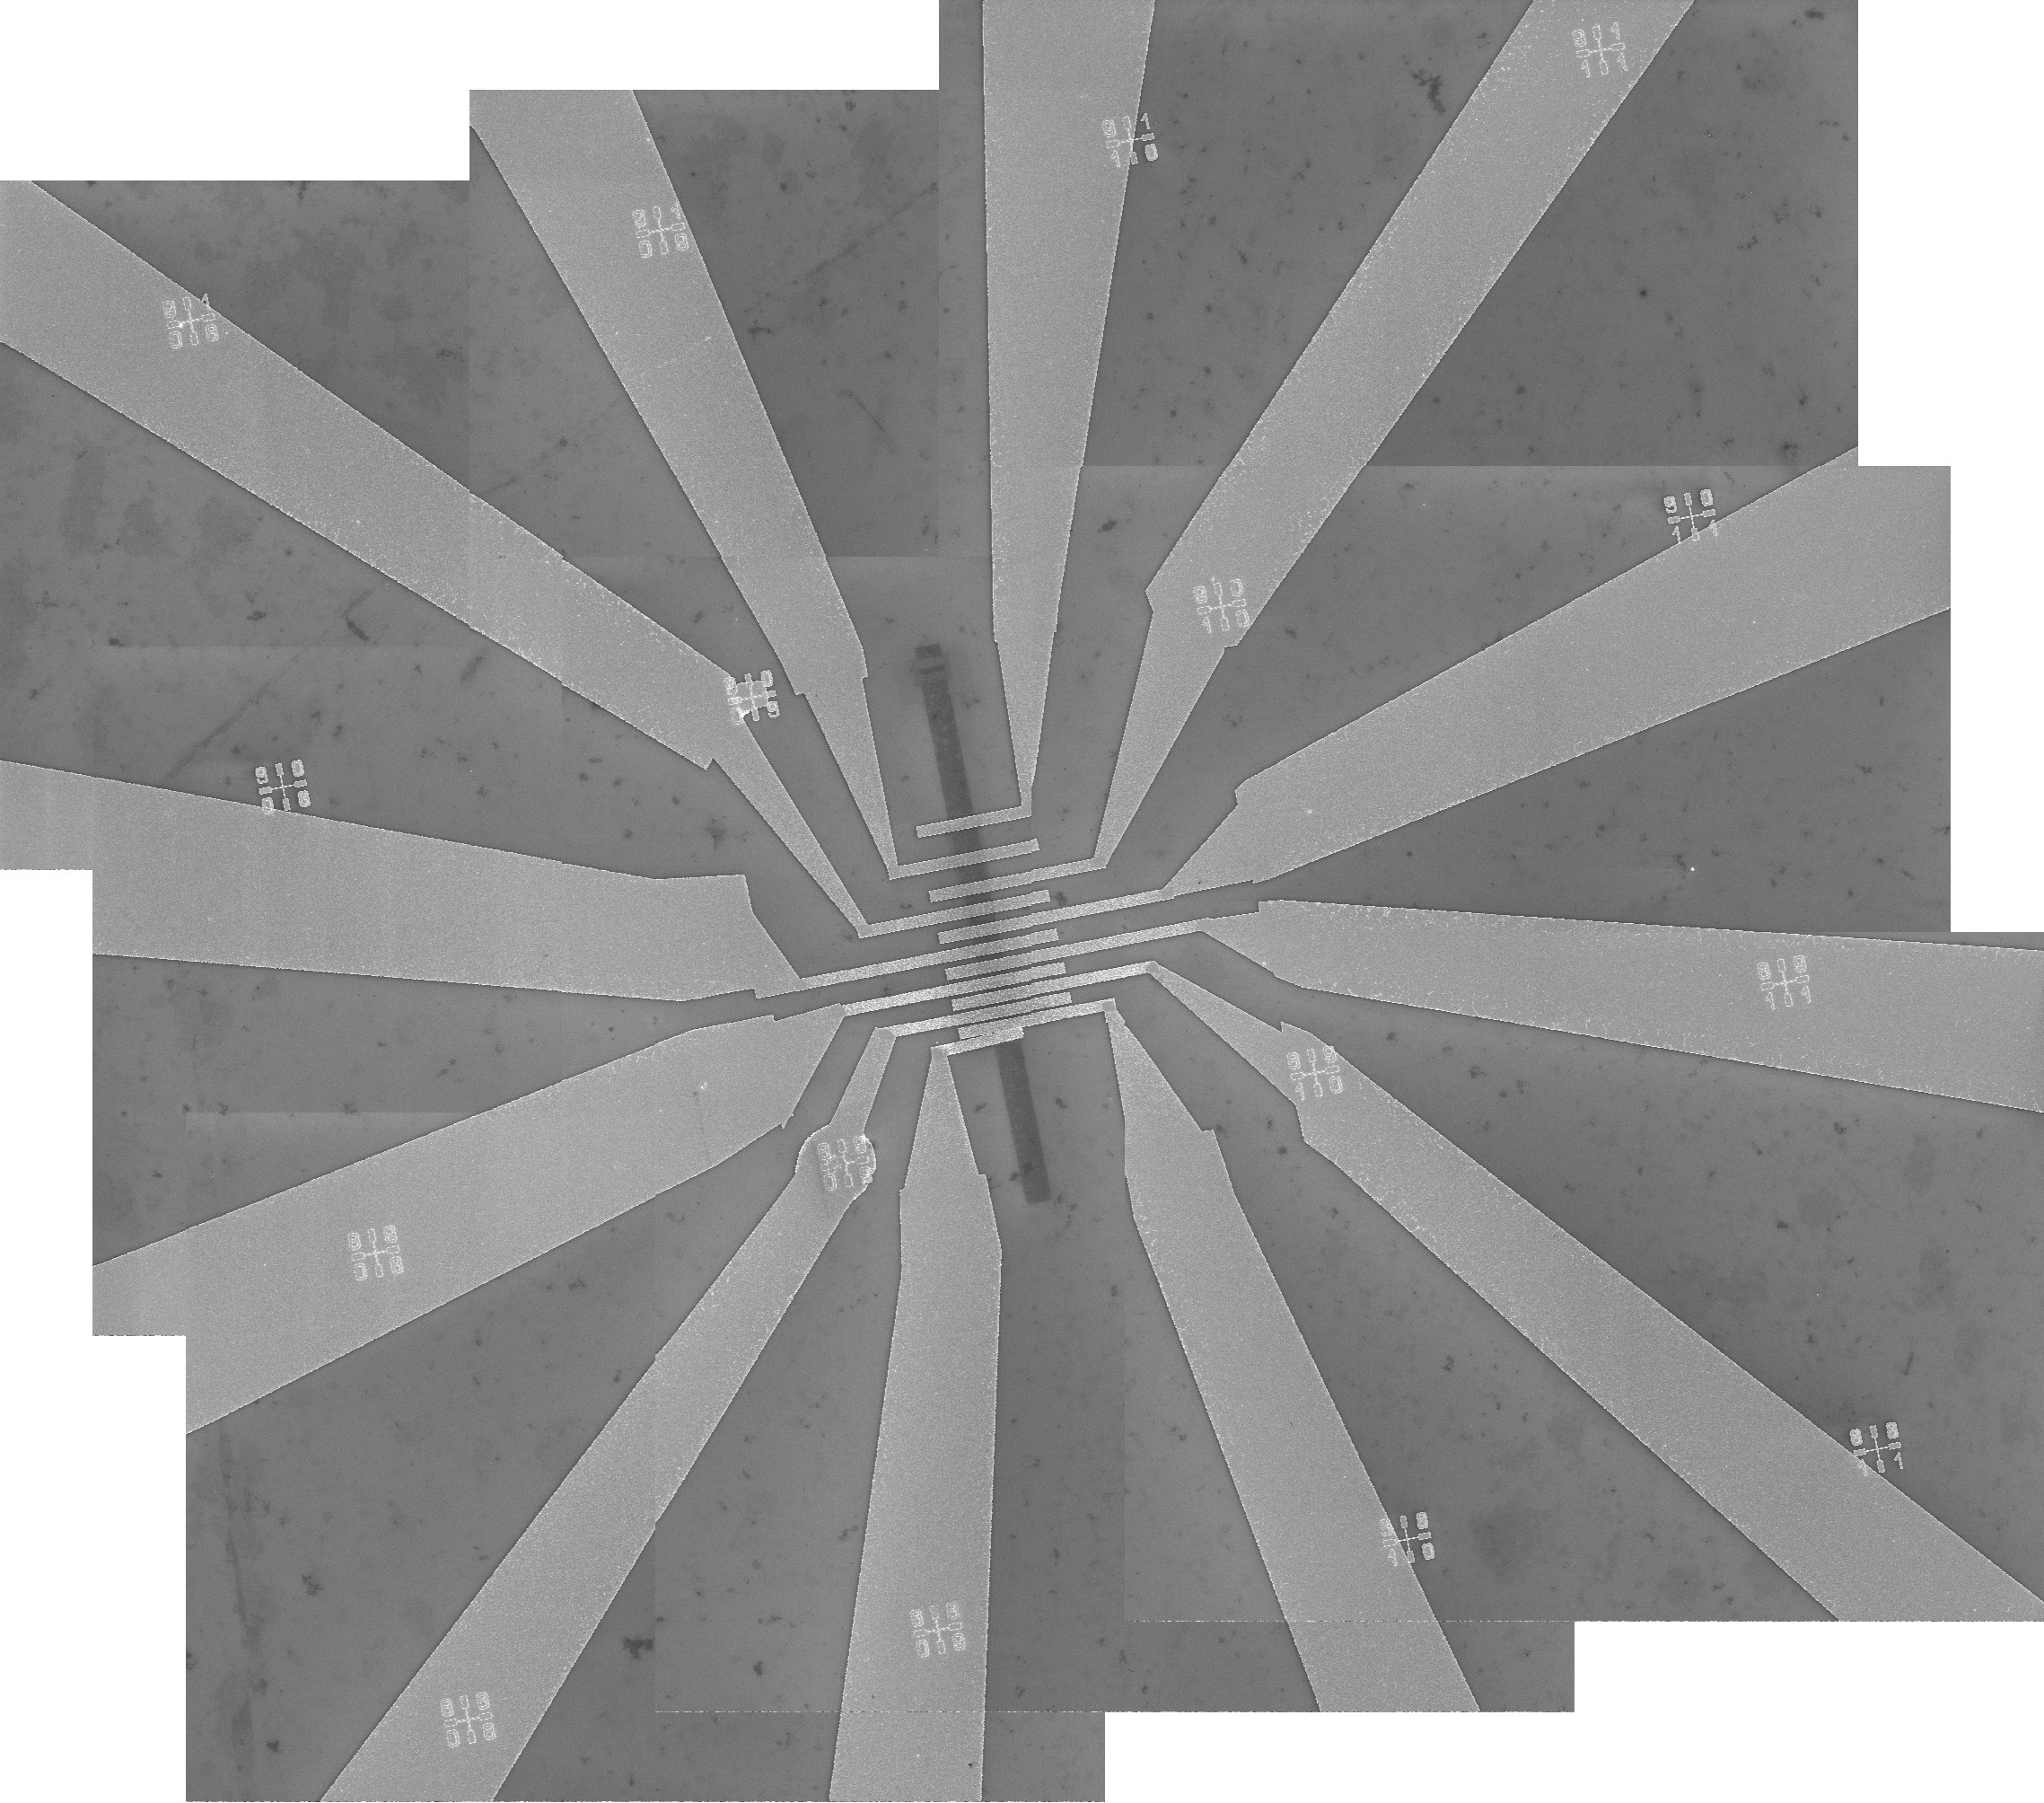
The mosaic image shown in Figure 29 is untransformed, and to load it into the design file, it must first be transformed, as described in Single image. To perform the transformation, follow the procedure briefly described below.
